
16K Cassette or 24K Disk
by Edward Loniewski
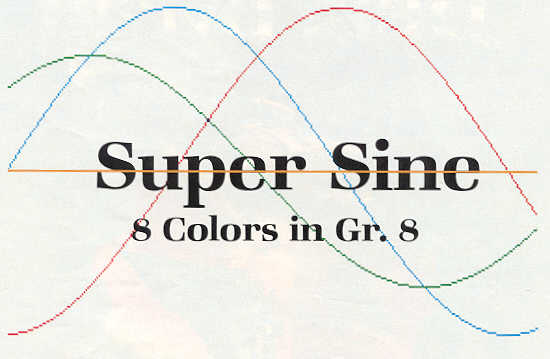
Super Sine was originally written to demonstrate the very powerful mathematical concept that any complicated curve can be approximated by some combination of sine and cosine functions. In case you're not overly familiar with sines and cosines, they are a pair of curves that trace out a simple wave shape that repeats itself every 360 degrees. They can be thought of as plotting the horizontal and vertical distances of a point on the circumference of a circle as that point moves completely around the circle. These distances are measured from the x- and y-axes that pass through the center of the circle. These curves have two characteristics, called frequency and amplitude, that can be changed in various ways to distort the basic sine wave. By adding or multiplying several sines and cosines together, an almost endless variety of complicated curves can be drawn.
The program described here is a very simple sine wave generator, yet it can produce incredibly beautiful results. It only deals with two curves at a time and only allows for changing the frequency. However, with very little effort, the program can be expanded further.
The frequencies of the 2 curves plotted here are denoted by the variables K1 and K2, which can be assigned any positive value whatever. The fun comes in experimenting with various pairs of frequencies and watching what happens. In addition, eight different patterns or combinations of sines and cosines can be plotted, as shown in the table below.
| PATTERN | COMBINATION |
|---|---|
| 1 | SIN(K1)+SIN(K2) |
| 2 | COS(K1)+COS(K2) |
| 3 | SIN(K1)+COS(K2) |
| 4 | SIN(K1)*COS(K2) |
| 5 | SIN(K1)-SIN(K2) |
| 6 | COS(K1)-COS(K2) |
| 7 | SIN(K1)*SIN(K2) |
| 8 | COS(K1)*COS(K2) |
Each pattern can be drawn as a mirror image of itself by using negative pattern numbers. In other words, pattern -5 will plot the mirror image of pattern 5. Thus, there are really 16 patterns available.
The final fancy trick is to allow plotting of more than one pattern on the same graph. All sixteen patterns could be drawn if desired, but usually four or less would be sufficient. All patterns drawn on one graph, though, will have the same pair of frequencies.
Two versions of the program are shown here. The second includes a speedy graphic dump to an Epson printer with GRAFTRAX. If you have a dump routine for a different printer, insert it where appropriate.
- Line 101 sets aside space for 450 precalculated sines and cosines (PCS) to save time in plotting later.
- Lines 105-107 draw the title and store the PCS values. POKE 710,0 turns the text window black to match the rest of the screen. Only 91 different sines are actually calculated, representing 0 through 90 degrees. All other values are gotten from the symmetric properties of the sine and from the fact that COS(X) = SIN(X+90).
- Lines 110-130 clear the screen for a new set of graphs. The POKE's to 709, 710, and 712 set the colors used. X0 and YFAC are scale factors. NPAT counts the patterns used. The PLOT's and DRAWTO's draw the x- and y-axes.
- Line 140 asks for the 2 frequencies. Values between 0 and 360 seem to work best, but any positive number will work. The program will end if a negative value is entered.
- Line 145 asks for the (next) pattern to be drawn. As described, any value between 1 and 8 or its negative is allowed. An illegal entry will be ignored. Enter 0 when you're done with a particular set of graphs.
- Lines 147-148 store the pattern and calculate scale factors.
- Lines 150-180 do the plotting of the functions specified. The program essentially plots the curves for 310 degrees (out of 360). Lines 152-154 keep the angles within bounds.
- Lines 200-205 sound a beep after each graph and return for another pattern.
- Lines 215-220 ask if you want to start a new graph. Otherwise, the program allows for more patterns on the current graph.
After entering the program, SAVE it to a cassette or disk and then get ready for some intriguing experimentation.
To get a good feel for how the program works, RUN the following examples:
- Kl=, K2=1, PATTERN 1 will plot a basic sine wave (with the right-most 50 degrees missing). Plot PATTERN -1 on top of this to see how the mirror image looks. Then plot PATTERN 2 and -2 on top to see a basic cosine wave and its mirror image. [Archiver's Note: This should probably say "K1=1, K2=1". The program doesn't work otherwise.]
- K1=.161, K2=1.161, PATTERN 1 will scale a complete sine wave into the 310 degrees plotted. This factor of 1.161 will be used several times later.
- K1=2, K2=2, PATTERN 1 will put twice as many hills and valleys as before, but still with a definite rhythm.
- K1=3, K2=4, PATTERN 3 shows some interesting bumps. Plot PATTERN -3 on top also.
- Radically increase the frequency to K1 = 10, K2=10, PATTERN 4 and look closely at the plot, which is really made up of bunches of short vertical lines. Notice that some parts appear white, some green, and others blue. This is all a consequence of color artifacting. Its effect will become even more apparent shortly.
- Try K1=21, K2=22, PATTERN 2 and notice the colors stand out even more.
- K1=40, K2=42, PATTERN 2 reveals definite bars of color. Remember that Gr.8 is only supposed to get you 1 1/2 colors. But already you should be able to distinguish 5 colors on the screen at one time. Color artifacting yields various colors depending upon whether the left or right side of a color block is turned on, or if adjacent halves are turned on.
- We are now ready for eye-openers. K1=60, K2=61, PATTERN 6 or K1=87, K2=90, PATTERN 3 should give you a good idea of the power and beauty of this program.
The following table yields some instructive and entertaining figures. When more than one pattern is given, study how the colors change with each succeeding plot. Sometimes the colors get filled in, sometimes they reverse, and sometimes they get cancelled to white or grey. Some of these combinations will actually wind up with eight colors on the screen at one time.
| K1, K2 | PATTERNS |
|---|---|
| 90, 92 | 5, -5 |
| 2, 179 | 1, -1 |
| 118, 120 | 3, -3 |
| 300, 303 | 7, -7 |
| 44, 45 | 4, -4 |
| 5, 90 | 2, 6 |
| 87, 93 | 1, -1, 4, -4 |
| 1.5, 2.85 | 3, -3, 4, -4 |
| 10, 120 | 4, -4 |
| 100, 101 | 4, -4 |
| 6, 7.161 | 7, -7, -8, 8 |
| 40, 42.32 | 5, -5, 6, -6 |
If you use the printer version of the program, the character in Line 102 is a [heart] (CTRL,). Change Line 145 to read 210. Add Line 210 and all of Lines 9000-9060.
The rest, now, is up to you. Experiment as much as you like. Try adapting the program to three or more frequencies, or add different patterns, or placing different frequencies on the same graph. If you're like me, you'll run out of time long before you run out of ideas.
By the way, this program can even be used to plot sines and cosines.
100 REM SUPER SINE
101 DIM PCS(450),PAT(16),YN$(1)
105 DEG :GRAPHICS 2:POKE 710,0:POSITIO
N 5,3:PRINT #6;"S U P E R":POSITION 6,
6:PRINT #6;"s i n e"
106 POKE 752,1:PRINT :PRINT "
PLEASE STAND BY"
107 FOR I=0 TO 90:X=SIN(I):PCS(I)=X:PC
S(I+180)=-X:PCS(180-I)=X:PCS(360-I)=-X
:PCS(I+360)=X:NEXT I
110 GRAPHICS 8:POKE 709,14:POKE 710,0:
POKE 712,68
120 COLOR 1:X0=10:YFAC=39:NPAT=0:TRAP
110
130 PLOT 0,80:DRAWTO 319,80:PLOT X0,0:
DRAWTO X0,159:PLOT 0,159:DRAWTO 319,15
9
140 PRINT "K1,K2=";:INPUT K1,K2
145 PRINT "PATTTERN";:INPUT ZT:IF ZT=0
 THEN 215
147 ARG1=-K1:ARG2=-K2:NPAT=NPAT+1:PAT(
NPAT)=ZT
148 PT=ABS(ZT):ZFAC=-YFAC*SGN(ZT)
150 FOR X=X0 TO 319
152 ARG1=ARG1+K1:ARG2=ARG2+K2
153 IF ARG1>360 THEN ARG1=ARG1-360:GOT
O 153
154 IF ARG2>360 THEN ARG2=ARG2-360:GOT
O 154
160 IF PT=1 THEN Y=80+ZFAC*(PCS(ARG1)+
PCS(ARG2))
162 IF PT=2 THEN Y=80+ZFAC*(PCS(ARG1+9
0)+PCS(ARG2+90))
164 IF PT=3 THEN Y=80+ZFAC*(PCS(ARG1)+
PCS(ARG2+90))
166 IF PT=4 THEN Y=80+ZFAC*(PCS(ARG1)*
PCS(ARG2+90))
168 IF PT=5 THEN Y=80+ZFAC*(PCS(ARG1)-
PCS(ARG2))
170 IF PT=6 THEN Y=80+ZFAC*(PCS(ARG1+9
0)-PCS(ARG2+90))
172 IF PT=7 THEN Y=80+ZFAC*(PCS(ARG1)*
PCS(ARG2))
174 IF PT=8 THEN Y=80+ZFAC*(PCS(ARG1+9
0)*PCS(ARG2+90))
178 IF X=X0 THEN PLOT X,Y
179 IF X<>X0 THEN DRAWTO X,Y
180 NEXT X
200 SOUND 0,40,10,6:FOR W=1 TO 50:NEXT
 W:SOUND 0,0,0,0
205 GOTO 145
215 PRINT "NEW GRAPH (Y/N)";:INPUT YN$
:IF YN$<>"Y" THEN 145
220 GOTO 110100 DATA 583,934,335,770,181,188,192,8
04,70,261,369,618,680,700,634,7319
154 DATA 643,180,772,472,474,206,791,2
00,792,686,256,782,789,707,574,8324
220 DATA 694,694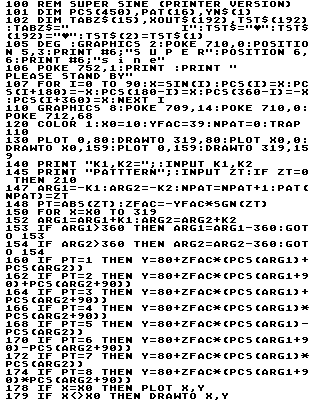
100 DATA 75,934,818,335,770,181,188,19
2,804,70,246,369,618,680,700,6980
153 DATA 634,643,180,772,472,474,206,7
91,200,792,686,256,782,789,707,8384
210 DATA 182,574,694,654,606,535,962,7
23,575,936,552,810,155,588,219,8765
9023 DATA 362,587,517,162,595,184,194,
2601
Digitized by Eric Petrich for CyberRoach’s Digital A.N.A.L.O.G. Archive; restored here with permission.