MATH ART
ELEGANT DESIGNS FROM SIMPLE EQUATIONS
by MARIAN LORENZ and ALLAN MOOSE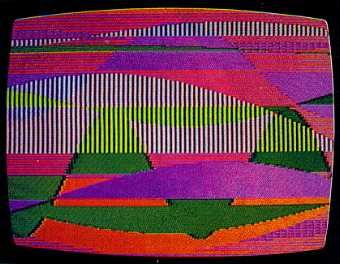
Artistic Mathematics draws a variety of stunning and intricate patterns based on sine waves. Your designs can be printed on a dot matrix printer or saved to disk for use with Micro-Painter graphics software. This BASIC program works on 8-bit Atari computers with 32K memory and a disk drive.
To many, art interprets the beauty of nature while mathematics interprets nature's essence. What better place is there to join these concepts than your Atari keyboard?
Armed with a few equations, you can easily create an infinite variety of intriguing patterns and colorful designs. The Artistic Mathematics program lets you use the equations to plot colorful and intricate patterns on your screen. When you're done, you can print your pattern on a dot-matrix printer, or you can save your design on a disk and use it with Micro-Painter software.
Listings 1 and 2 show you how to use the sine function for drawing artistic patterns on the screen that resemble landscapes. Listing 1 plots sine curves of random color and size, Listing 2 lets you design your own sine curves. Both listings let you print your favorite patterns on Epson or Star printers, or save them to disk for use with Micro-Painter graphics software.
Type in Listing 1, MATHART1 BAS, checking it with TYPO II, and SAVE a copy before you RUN it. If you have trouble with the special characters in lines 46, 750 and 830, don't bother typing them in. Listing 3 will create them for you. When you RUN Listing 3, it creates a disk file called D:LINES.LST which contains the above lines. Now, type NEW, LOAD Listing 1 and ENTER "D:LINES. LST". You may also use D:LINES.LST with Listing 2, MATHART2.BAS. Remember to SAVE your completed programs before you RUN them.
THE MATHEMATICS
The sine function is ideal for generating many interesting and attractive
curves. In fact, Fourier's Theorem states that any reasonable curve
can be represented by the right combination of sine curves.
If you've never worked with sine curves before, they're pretty easy to understand. All sine curves are based on circles. Let's try this simple visualization exercise. Imagine a clock with a second hand that is one meter long. This clock has a horizontal red line drawn between the 3 and the 9.
Watch the tip of the second hand. When the second hand points to the 9, its tip lies on the red line. Five seconds later, the tip is 0.5 meters above the red line. Five more seconds and the second hand points to the 10- about 0.866 meters above our line. When the second hand points to the 12, it is at maximum height above the red line-one meter. As the second hand continues around the clock, the tip alternately rises above and falls below our line. If we graph this rising and falling, the result is a sine curve.
Figure 1 illustrates a basic sine curve. Here, A is the amplitude (height) of the curve. In our clock example, the amplitude was the second hand's maximum height above the red line-one meter.
The tip of the second hand circles the clock once each
minute. Its period is equal to one. If we doubled the speed of the
second hand, it would circle the clockface twice each minute, and its period
would be equal to two cycles per minute.
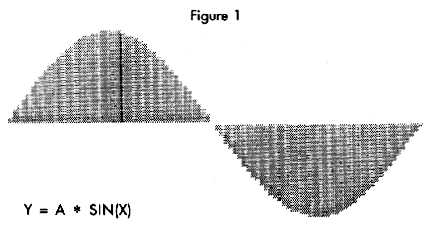
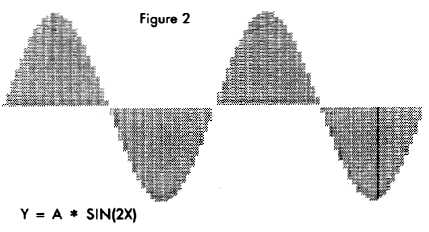
But since a sine curve is so closely related to circles and distances, periods are measured in cycles per 360 degrees (length), instead of cycles per minute (time). The sine curve in Figure 1 has a period of one, while the sine curve in Figure 2 has a period of two. Note that we merely multiplied X by two to get this curve. If we wanted a sine curve with a period of 100, we'd simply multiply X by 100 instead of two.
If we multiply X by 0.5, our curve would complete one
half of a cycle in 360 degrees. Thus we can adjust the period, or length,
of a cycle by multiplying or dividing X by some number.
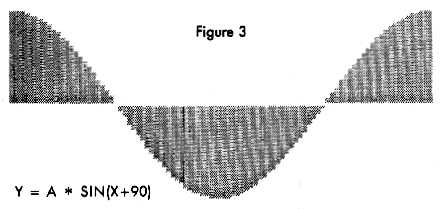
We can slide our curves left and right by adding and subtracting numbers to X. Adding numbers to X will shift the curve to the left (see Figure 3), and subtracting numbers will shift it right.
The angle added or subtracted is sometimes called the phase angle.
Notice that shifting the phase angle does not change the period or the amplitude. The shifted sine curve still completes one cycle in 360 degrees.
In summary, the fundamental ingredients for producing
variety in the sine curve are:
Amplitude (Height)
Period (Length)
Phase (Shifting the curve left or right)
THE PROGRAMS
Listing 1 uses a random number generator to vary the amplitude, period,
phase angle, color and placement of the sine curves. The sense of depth
and texture is due to the random overlapping of curves and lines. Listing
2 lets you choose values for all of these parameters.
Each time the program adds a curve to the screen, a window
appears and asks you whether you want to [Q]uit the program, [P]rint the
picture, [S]ave the picture in Micro-Painter format, or [C]ontinue adding
curves to the screen.
"Pop-up" text windows are used when you want to add and remove
text windows without erasing the graphics on the screen. To add
a pop-up window, just add 32 to the BASIC graphics mode number when you
make your GRAPHICS call. In Listings 1 and 2, the variable GM represents
this graphics mode number. (The statement GRAPHICS 7+32, for example, will
add a pop-up text window to a Graphics 7 screen.) See line 355 in Listings
1 and 2 for more examples of this technique.
Similarly, we can remove the pop-up window by adding 42 to the mode number. See line 420 in Listings 1 and 2 for examples.
Happily, pop-up text windows can be used with many types of modified display lists. (Just remember to re-modify it after each GRAPHICS call.) Both Listing 1 and Listing 2 use a modified display list whenever they are RUN on a 400 or 800 series computer.
If you own a 400 or 800 series computer, you've probably gotten "cursor out-of-bounds" errors when using BASIC's PLOT and DRAWTO commands on a Graphics + screen. We can solve that problem with two powerful machine-language USR routines.
The first machine-language routine (line 830) copies BASIC's PLOT and DRAWTO routines from ROM into RAM. Once in RAM, the routine deletes the instructions which perform BASIC's "out-of-bounds" checking. We use this modified routine in place of BASIC's PLOT and DRAWTO commands.
The USR routine in line 320 accesses our modified plotting routine, and is used in place of BASIC's PLOT and DRAWTO commands. In this line, X and AXIS are the starting (X,Y) coordinates of the line to be drawn, and X and Y are the ending coordinates.
Unfortunately, this routine does not work well with the XL-series Atari computers.
SAVING YOUR WORK
If you create a pattern you want to save, you can print it with the
[P]rint option from the menu window. The screen dump routine (lines 400-730)
is taken from the article by Jerry White and Fernando Herrera (Antic,
January 1984). It has been modified to work with Epson, Gemini and Star
dot-matrix printers.
You can also save your picture for use with Micro-Painter software. Just choose the [S]ave option from the menu window. Each picture requires 62 sectors of disk space. You can use the Rapid Graphics Converter (Antic, November 1985) to convert this picture into almost any other format.
Feel free to modify the equations in the program. You can mix and match sine curves to generate almost any mathematically defined curve. We leave it to you to explore many more of the possible combinations.
Marian Lorenz leads a pre-school program for handicapped children
in Central Islip. Allan Moose is an associate professor of physics and
mathematics at Southampton College. The two Long Islanders collaborated
on a 6502 assembly language book which will be published shortly.
Listing 1 MATHART1.BAS Download
Listing 2 MATHART2.BAS Download
Listing 3 LINES.BAS (not needed)