DECIDE
BUSINESS DECISION ANALYSIS TECHNIQUES
by JEFFREY SUMMERS, MDThink-tanks and major corporations often rely on computerized analysis techniques to help decide among complex alternatives. This tutorial article shows you bow to use these principles to design your own "decision tree." The accompanying BASIC program processes your decision tree calculations. The program works on all 8-bit Atari computers with minimum 48K disk or 32K cassette.
Here's the problem. You are the CEO of MegaCorp and your multinational corporation wants to manufacture a product for marketing in the United States. Three sites are under consideration for the new factories. But each has its own advantages and disadvantages.
The first site is here in the U.S. and the estimated profit would be 80 cents per item. The second site is in Country A, where labor and other costs are lower-but insurgent groups are fighting the government. Best estimates are that there is a 15% chance of a revolution. If there is a revolution, then there will be a 50-50 chance that the industries will be nationalized. If all goes well, the profit per item will be 87 cents. However, the profit. will be reduced to 85 cents if there is a revolution without nationalization. If the industries are nationalized, then there will be no profits at all.
The third site is in Country B, which has a stable government. But the U.S. is considering raising the tariff duties on merchandise imported from there. The profit per item will be 84 cents if the tariffs remain the same, 78 cents if the tariffs are raised. Your political analysts have determined that there is a 20 percent chance of the change in tariffs.
It's a tough decision! However, the technique of computerized decision analysis (CDA) allows for the calculation of the best choice. If you have ever wondered how economists or political scientists use computers to simulate and test alternate scenarios for future events, this article will introduce you to the concepts and techniques of CDA.
Then after you learn how to design your own decision tree shells, you can use the accompanying BASIC program to process all the calculations needed to arrive at the most suitable decisions.
This decision analysis technique uses a tree type of data structure. It is helpful to think of the decision "tree" as a roadmap. The diagrammed route is made of branches that are connected by nodes. These nodes are like forks in the road-where there is more than one path ahead. Branches are the labelled paths leading away from the node. A node has the same label as the branch which led to it.
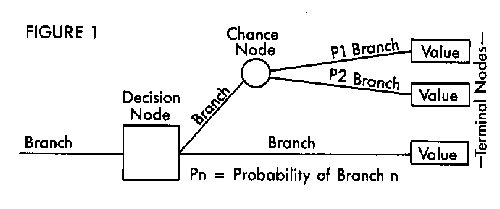
The three types of nodes are shown in Figure 1. A decision node represents a choice that you can control. ("Should I manufacture in Country A, Country B, or the U.S.?") Decision nodes are indicated by squares.
A chance node represents a path determined by factors beyond your control. For example, "Will there be a revolution in Country A?" Chance nodes are indicated by circles.
Each of the branches leading from a chance node has an associated probability of being taken-as in a 20 percent chance of revolution. These probabilities are marked on the branches as they leave the node.
A third type of node occurs at the end of each path and is therefore called a terminal node. The terminal node is indicated by a rectangle displaying its value, on any relevant scale. The possibility, "We'll make 87 cents profit per item if you decide to manufacture in Country A and all goes well" is an example of a terminal node.
TREE DIAGRAM
Figure 2 is a diagram of MegaCorp's multinational profit problem
using the above symbols. You start reading this diagram from the left-that's
the bottom of the tree. To begin with, you have the choice between three
manufacturing sites-the U.S., Country A and Country B.
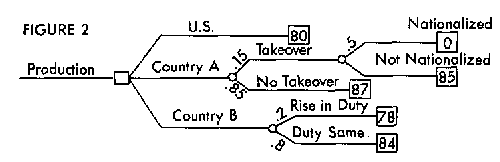
The first alternative, manufacturing in the U.S., would lead directly to a terminal node. Nothing more needs to be considered if this option is chosen. Assign this terminal node a value of 80-the profit per item if you manufacture our products in the U.S.
The second alternative, manufacturing in Country A, has several other considerations. The first is whether or not a takeover occurs. You have no control over this, so you add a chance node and label its branches "Takeover" and "No Takeover."
Further, the Takeover branch has a 50 percent probability of industrial nationalization. So you add a chance node to the Takeover branch. This chance node has two branches, labelled "Nationalized" and "Not Nationalized." See the upper right portion of Figure 2.
Country B faces the possibility of increased tariffs for imports into the U.S., which is also out of your control, so you add a chance node to this branch. The branches from this node are labelled "Rise in Duty" and "Duty Same." Each of these branches end in terminal nodes with profit values assigned as stated earlier in the problem (78 cents per item if the tariffs are raised, 84 cents if the tariffs remain the same). We have now completed our tree. See the lower right portion of Figure 2.
TREE SOLVING
Now that you have this tree, what do you do with it? Essentially, you
need to assign values to each of the nodes you have created, working all
the way back from the "treetop" to the first decision node. The process
of solving the tree is governed by two basic rules:
1. The value of a decision node is the maximum or minimum-whichever is more desirable-of all values in a pathway that goes away from it.
2. The value of a chance node is the sum of the values of all branches that come from it, multiplied by their respective probabilities (p1 * al + p2* a2, etc.).
For example, if you decide to manufacture in the U.S., your profit would be 80 cents per item (shown in the pathway's terminal node). Since there are no chance nodes to complicate this calculation, the value of that pathway's decision node would also be 80. You must then repeat this process for any other alternative pathways leading from this decision node.
Our sample problem has only one decision node, which makes it comparatively simple. If a problem has multiple decision nodes, we must solve and assign a value to each one. Thus, after solving each decision node we would assign it a "terminal node" value, while we continue to work our way back downward to the root decision node.
Let's find the value of the decision node for the Country A. Working backwards from the terminal nodes, you see that you'll make 87 cents per item if there is no takeover. And remember, there is an 85 percent chance of this happening. This branch has a value of (87) * (.85), or 73.95.
If there is a takeover, there is a 50-50 chance of industrial nationalization. If the industries become nationalized, our profit-per-item is zero, and the value of the Nationalization branch is equal to (.5) * (0), or 0. If the industries do not become nationalized, our profit would be 85 cents, and the value of this branch would be (.5) * (85), or 42.5.
Again, you'll only reach these branches if a takeover occurs. Since there is a 15 percent chance of this happening, you add your Nationalized and Not Nationalized totals together (42.5 + 0) and multiply it by the probability of a takeover (.15) to find that the value of the Takeover branch is 42.5 * .15, or 6.375.
Now, you add the value of the No Takeover branch (73.95) to the value of the Takeover branch (6.375) to find that the value of the Country A branch is 73.95 + 6.375, or 80.325).
By the same method, you find that the value of the Country B branch is 82.8.
Now you have all the information you need to make a decision:
Branch: Value
U.S.
80
Country A 80.325
Country B 82.8
Since you wish to maximize your profits, you should make the product in Country B.
This problem has only 10 nodes, yet it takes a fair amount of time to calculate. What if you weren't sure about the chance of takeover? Would the decision change if the risk was only 10 percent? Five percent? Recalculating the tree for multiple probabilities would be tedious-and didn't you buy your computer to simplify these chores?
THE PROGRAM
This program allows computation of trees up to 200 nodes in complexity,
and allows quick recalculation of the tree with changed what-if values.
Type in Listing 1, DECIDE.BAS, check it with TYPO II and SAVE a copy before you RUN it.
To use this program for help with making your best decisions, you must first design your decision tree on paper. Assign values to each of the possible outcomes, and estimate the probabilities at each chance node. We'll use the MegaCorp problem example and the tree as outlined in Figure 4.
Type RUN and choose the New Tree option to enter your tree.
The program asks for the first node's type-decision, chance or terminal. Choose option 1-decision. When asked for the number of branches leading from this node, respond with 3. The program can handle up to five branches from each decision node or chance node.
Every node is labelled according to the branch, or path, leading to it. Since this is the first node, and has no paths leading to it, you'll arbitrarily label it "Production."
You are then asked about node 2, (branched from node 1). This node represents manufacturing the product in the U.S. Since it is a terminal node, choose option 3 and enter a terminal value of 80. Label this node "U.S."
Node 3, also branched from node 1, represents Country A, and should be labelled as such. (This is where you branch to the "Takeover" and "No Takeover" nodes). Node 3 is a chance node (option 2) with two branches. The probability of the Takeover branch is .15 and therefore the probability of the second branch (No Takeover) is .85.
Node 4, representing Country B, is the final branch from node 1. It is also a chance node with two branches. This time, the probabilities are .2 ("Rise in Duty") and .8, ("Duty Same").
The fifth node-branched from node 3-is Country A's Takeover node. It's a chance node with two branches and equal probabilities of .5 and .5. Label this node "Takeover".
Node 6, again from node 3, is Country A's "No Takeover" node, a terminal node with a value of 87.
Node 7 is a terminal node, coming from node 4 (Country B). It has a value of 78. Label this node "Rise In Duty."
Node 8, also from node 4, is another terminal node. Its value is 84, and is labelled "Duty Same."
Node 9 comes from node 5 (Takeover) and is a terminal node which you will label "Nationalized." This node has a value of 0.
Finally, node 10 comes from the same node as 9, and is another terminal node. It has a value of 85, and is labelled "Not Nationalized." The program now sees a completed tree and returns you to the main menu.
THE RIGHT PATH
Save the tree by choosing the Save Tree option and then entering a
legal filename. Later, you can recover the tree, with values intact, by
using the Recover Tree option and entering the same filename.
Now solve the tree. Choose the Solve Tree option and the program will ask you whether you want to maximize or minimize your results. Since you want the results to lead to maximized profits, select option 1.
After a few seconds the main menu again appears. To see the results, choose the Print Tree option. Enter a legal filename or device at the "Output to:" prompt and the tree will be printed. You may print the tree to a disk file, to your screen, or to a printer. Using a printer makes the output easier to follow.
Each node in the output is identified on the first line by its node number and label. The type and value are on the second line. The next line states where the node branched from. (The first node branched from node 0- the root of the problem.) The following lines list the branches from this node. Chance nodes give the probabilities of each of their branches. Terminal nodes have no branches and these lines are omitted.
To see which branch should be taken at a decision node, remember that the optimum branch will always have the same value as the decision node. (This will be the highest value if you're maximizing, and the lowest value if you're minimizing.) In this example, you can expect an average profit of 82.8 cents per item by choosing Country B- node 4 matches node 1.
EDITING THE TREE
Choose the Edit Tree option and you can add branches and nodes, delete
branches and nodes, change probabilities and labels. You are asked for
the node number you wish to edit (entering a zero returns you to the main
menu). Perhaps you want to see if changing the probabilities of takeover
would change your decisions. These probabilities are governed by node 3,
the chance node labelled Country A.
After typing a 3 you are given a sub-menu. Choose option 4 to change the probabilities. You are given a list of the branches and probabilities from this node, then you're asked for the new probability of a branch to node 5. Enter .10. (Thus, the probability of a branch to node 6 is .90.) Exit with option 0 and node 0, solve the tree again and print it. Does that change the decision?
Try repeating the above steps to change the probabilities to .05 and .95. Now the decision changes to Country A. Testing your conclusion by varying the data you have the least confidence in can give you a better idea of the validity of your decision. This is called "sensitivity analysis." Finding the point where the decision changes from one option to another is called "threshold analysis." In this case that point is where the probability of government overthrow is somewhere between 5 and 10 percent. If you feel ambitious you can try to find the exact number.
Jeffrey Summers, MD is a practicing internist in Rochester NY. He has been programming the Atari for three years and is interested in computer applications for medicine.
Listing 1 DECIDE.BAS Download