StatWhiz
Analyzing numerical data with your Atari
By Bernard Sparks, III
Got some data you need to interpret?
Now your Atari can find far more than just the average of your figures. If you know your way around regressions, correlations, ANOVAs and T-Tests, you can thoroughly analyze your statistics with StatWhiz. This BASIC program runs on an 8-bit Atari with a minimum of 48K and disk drive.
Statistics play a vital role in modern society. Everything from the movies people rent to the toothpaste they prefer is studied at one time or another. When all the information has been gathered, statistics provide the tools needed to interpret your data. At its most basic level, General Statistics will take the data for a single group and give you the maximum, minimum and mean (average) values, as well as the variance and standard deviation.
StatWhiz is a BASIC program which brings the power of statistical analysis to the 8-bit Atari computers. StatWhiz is easy to use -- if you have at least some knowledge of statistical methods and terminology. For example, StatWhiz supports both descriptive and inferential statistics and offers both independent and dependent T-test, as well as one and two-way ANOVA, chi square, Pearson correlation, and regression.
GETTING STARTED
Type in STATWHIZ.BAS, Listing 1, check it with TYPO II, and save a copy to disk before you RUN the program.
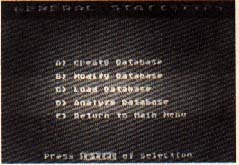
After the title screen, the main menu presents the statistical functions available in StatWhiz. Pressing the letters A-H will access the corresponding test. You will then be presented a sub-menu of the following options:
CREATE DATABASE - Initially, you will need to develop a database from which to perform your analysis. Entering the data is quite easy, as the program will prompt you through the various steps. Press [RETURN] after each data entry. Answer the prompts by pressing the appropriate letter. (No [RETURN] is necessary.) All sample data must be continuous, with a maximum of 225 subjects per sample group.
Often, you can enter or load your data in one module and then use it in another - if the number of groups and subjects are compatible. The limits for sample group size are as follows:
TEST:            # SAMPLE GROUPS:
Gen. Statistics    1-8
T-test (I)         2
T-test (D)         2
One way ANOVA      2-8
Two way ANOVA      2-8
Chi Square         2-4
Correlation        2
Regression         2
For the dependent T-test, two-way analysis of variance (ANOVA), Pearson correlation, and regression, the sample groups must have an equal number of subjects. Additionally, the two-way ANOVA requires that the sample groups have an even number of subjects.
The size of a chi square is limited to a minimum 2 x 2 and maximum 4 x 4 contingency table. The data for a 2 x 2 table would be coded in as two sample groups of two subjects each. The values of each subject would reflect the individual cells of the chi square.
MODIFY DATABASE - This option allows you to change the data values in a given sample group. The program will prompt you through the steps.
LOAD DATABASE - This option lets you load an already entered database from disk. Each test module saves its data with a different filename, but you can still load the database while in one test module and then go to another to analyze it. For example, you could load a set of data from the regression function and then perform a correlation on it.
ANALYZE DATABASE - Selecting this option results in the chosen analysis being performed on the data. Of special note is the way StatWhiz handles a two-way ANOVA. The program will split the data at the mid-point and then treat the values as the two rows of the ANOVA.
Each inferential test will also provide a probability, or P-value. If the P-value is smaller than the selected level of confidence, it indicates a significant difference in the means of the sample groups. Any assumptions that the samples were drawn from the same population must be rejected.
ABOUT STATISTICS
StatWhiz is basically an 8-bit Atari translation of several commonly used statistical formulas. These tests allow you to describe and make inferences about a larger population by sampling a subset of it. The specific outputs of the program are as follows:
MEAN - This is the arithmetic sum of the sample values divided by the number of values. It results in the average sample value.
VARIANCE - This is the degree to which independent samples differ from the average sample value. Variance is calculated by squaring the difference between the sample value and the mean, summing the squares, and dividing by the number of sample values.
STANDARD DEVIATION - The standard deviation is obtained by taking the square root of the variance. It provides a stable range of variance in terms of the original sample measurements.
RANGE - The range is the simplest measure of variance. In StatWhiz, the range is provided by the maximum and minimum sample values. The range has limited value in large samples but may assist in testing the significance of small samples.
INDEPENDENT T-TEST - The Student's t or T-test allows you to evaluate two independent samples for significant differences between their means. An example would be the sprint times of two groups of athletes running under different conditions.
In order to evaluate the significance of the calculated t value, you will need the table of critical t values which is listed in most books on statistics. If the calculated t value is greater than the tabled value for t, the difference between the sample means is significant - in other words, the differences did not occur because of chance.
DEPENDENT T-TEST - When subjects are tested before and after exposure to experimental conditions, changes in their performance can be evaluated by a dependent T-test. The analysis of the dependent t value is the same as for the independent t. However, both T- tests assume the sample values were drawn from a population with a normal distribution.
ONE-WAY ANOVA - A one way analysis of variance is used to test the significance of the differences between means of several different sample populations.
StatWhiz can calculate up to eight sample groups of 225 subjects each. The resulting F value must be enterpreted using the table of critical F values found in most statistics books. As with the t value, if the calculated F value is greater than the critical F, the difference in sample means is significant and, in all likelihood, did not result from chance. An example of a one-way ANOVA would he the assessment of growth rates for a single strain of grass grown in four different types of soil.
TWO-WAY ANOVA - A two-way ANOVA measures two experimental variables at the same time. StatWhiz employs a complex formula to calculate this interaction and unfortunately is quite slow.
The output of this test yields three F values (row, column and interaction). Each must be evaluated separately for significance using a table of critical F values. The program assumes an equal, even number of subjects in each sample group. An example of a two-way ANOVA would be the growth effects of sunlight and darkness on three different strains of grass seed (slow, medium, and fast growing).
CHI SQUARE - This test allows you to compare observed with theoretical frequencies. It is a non-parametric statistic which is independent of normal distribution expectations. The calculated X2 value must be evaluated using a table of critical X2 found in most statistics texts. If the calculated X2 exceeds the critical X2 the observed differences are significant and did not happen by chance. For small samples with cell values of less than 5, the program employs the Yates correction for continuity. This improves the validity of the calculated X2.
CORRELATION - This is the degree to which sample values relate to each other. StatWhiz calculates the Pearson product-moment correlation coefficient. A perfect, positive correlation results in an r value of 1. A perfect, negative correlation is evidenced by an r value of -1. The closer the r value is to 0 the less likely a relationship exists.
REGRESSION - When a correlation exists, predictions can be made concerning one value when another one is known. This linear relationship is illustrated by a regression. The output equation of StatWhiz allows you to make predictions from related data, such as predicting a student's test score based on a knowledge of his IQ score.
I wish to acknowledge that the routines for calculating P-values were modeled after Dr. Tracy Gustafson's excellent public domain program for the IBM PC, Epistat.
Bernard Sparks, III is Director of Externships and a member of the clinical faculty at Southern College of optometry in Memphis, Tennesse. He uses his Atari 800 system to manage student files and schedules.
Listing:STATWHIZ.BAS Download