Got-A-Minute Graphics
Six short ST stunners
By MARIAN LORENZ and ALLAN MOOSE
Got-A-Minute Graphics are six short, eye-popping, easy-to-type GFA BASIC color demonstrations-each one requiring less than 30 lines of code. These brief programs showcase many of the most powerful graphics capabilities of the ST. Because of their short, uncomplicated code and the fact that several of the programs have roots in mathematical formulas, they lend themselves to experimentation. For example, a simple value change in a color statement produces interesting variations.
Several suggested variations ask you to delete a line or two from the program. To avoid retyping this line later, you can simply turn the line into a comment. Just precede the line with a single quotation mark ['] or the word Rem. BASIC ignores lines with these marks and your program will run as if the lines weren't there. To make BASIC recognize the line again, remove the quote mark or the word Rem
THE PROGRAMS
The six Got-A-Minute graphics programs were designed to run on the
ST color monitor in low resolution to make use of the 16 available colors,
but many can run in medium resolution with four colors. Some will even
run on the monochrome monitor, but they don't look very good.
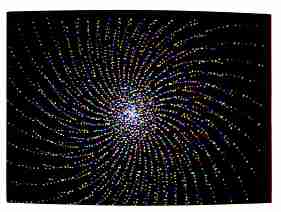
Listing 1, FIREWORK.BAS, brings Fourth of July fireworks to mind. The sine and cosine functions create an underlying spiral pattern. Here are some suggestions:
1. Change the value of R to one of these:
R = Sqr(Point)
R = 20* Sin(2 * Point)
R = 20 * Cos(2 * Point)
R = Log(Point)
R = Log10(Point)
R = Atn(Point)
2. Increase or decrease the number of points plotted, such as:
For Point 1 To 3000
3. Increase or decrease the step size, as in this line:
For Point = 1 To 3000 Step 0.5
4. Remove the lines:
X = (Point + C)/16 * Cos(Point + C + 60)
Y= (Point + C)/16 * Sin(Point + C + 60)
Plot X + Xcent,Y+Ycent
X = (Point + C)/16 * Cos(Point + C + 60)
Y= (Point + C)/16 * Sin(Point + C + 60)
5. Modify lines:
The fireworks program runs as is, in medium resolution.
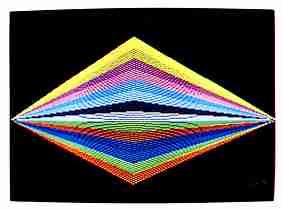
Listing 2, DIAMOND.BAS, is so simple that you'll be surprised at the designs it can create. This program forms a colorful diamond shape. After you type it in and run it, we suggest first experimenting with a single colored diamond because of the pattern generated by the GFA BASIC Draw To routine.
Try eliminating the Fill 0,0 statement and the C = Row/10 statement, and change Color C to Color 1, which draws a black diamond. Now experiment with the step size- try non-integer step sizes. Then re-enter the Fill command and C = Row/10. Try changing the value of the divisor in this line or try one of these lines:
C=Sqr(Row)
C=Tan(Row)
C=Log(Row)
C=Log10(Row)
C=10 * Cos(Row)
C=10* Sin(Row)
C=20*Sin(2*Row)
C=20*Cos(2 *Row)
To run the diamond program in medium resolution:
1. Before the Fill 0,0 statement, add the line C = 1.
2. Replace C = Row/lO with the following lines:
C=C+1
If C 4 Then
C=1
Endif
MOIRE
When you look through a window screen that's in front of another window
screen, you'll see something called a moire (pronounced mwa-RAY or more-RAY)
pattern. Such patterns are created whenever two periodic structures are
overlapped. The design in the diamond program is a moire-like pattern.
Listing 3, MOIRE.BAS, also draws a moire pattern, but it doesn't depend on overlapping structures and can create other designs as well. You can experiment with different values for Style, but Moire works best with Style<1. As well as using other mathematical functions to determine the color number, try these changes:
Change the 2 to a 3 in the following line:
C=(190-Int((Vert * Vert + Horz * Horz)^ Style)/2)
Now delete the next line, and replace it with one of these:
C=Tan(C),
C=20*Tan(C)
C=16*Sin(C)
For additional interesting variations, you could also eliminate this line:
Plot 320-Horz1,Yert1:
Listing 4, STARS.BAS, creates a starlike design. The Rnd statement makes the computer generate a different design each time the program is run. Try:
1. Changing the range of J in the For statement. This changes the size of the design.
2. Increase or decrease the step size. Non-integer step sizes, such as 0.5, yield particularly interesting patterns.
3. Change the color statement using the math functions suggested previously. The Stars program runs in medium resolution as is.
Listing 5, SINESCAP.BAS, uses a series of sine waves to build an abstract design:
1. Change the equation Y= Amp * (Sin(X/Per-Phi)) + Axis and the Draw To statements to:
Y=Amp * ((Sin(X/Per-Phi))^2)
Plot X,Y
Draw X,Y+ Axis To X,Axis-Y
2. Change:
Amp=Int(Map2 * Rnd(1)) to
Amp=.5* Int(Plot2 * Rnd(1))
and change
Per=Int(100 * Rnd(1) +1) to
Per1=Int(100 * Rnd(1))
Below these changes, add the line:
Per2 = Int(80 * Rnd(1))
Change:
Y=Amp * (Sin(X/Perl-Phi)) + Axis to
Y=Amp * (Sin(X/Penl-Phi) + Cos(X/Per2 + Phi/2))
and change
Draw X,Y To X,Axis to
Draw X,Y+ Axis To Axis-Y
3. For Sine=1 to 10 is the line that controls the number of sine waves drawn on the screen. You may wish to change this value.
4. Experiment with color selection. Sinewaves runs in medium resolution if you increase the values to accomodate the screen dimensions and change the value of C.
Listing 6, PASCAL.BAS, creates the well-known image of Pascal's Triangle. Experimentation will yield some interesting new designs, but you'll no longer have the classic Pascal Triangle.
1. Change the range of I.
2. Change the DIMension of T.
3. Change colors by adjusting the values in the line:
C=2*(Not(T(A))+8)
Marian Lorenz and Allan Moose are teachers on Long Island, New York. They have published a number of mathematics-oriented Antic programs for both the Atari 8-bit and ST computers.
Listing 1 FIREWORK.BAS Download
Listing 2 DIAMOND.BAS Download
Listing 3 MOIRE.BAS Download
Listing 4 STARS.BAS Download
Listing 5 SINESCAP.BAS Download
Listing 6 PASCAL.BAS Download