Review
Star Light, Star Bright
Atari Planetarium and Robtek Skyplot
by Jim Pierson-Perry
Twinkle, twinkle little star--how can I tell which one you are? At one time or another, just about everyone has indulged in a bit of star gazing. Trying to make sense from patterns in the night sky has been one of my favorite preoccupations.
Atari Planetarium and Robtek Skyplot are two programs that bring the fascinating science of astronomy to your ST. While differing in style and depth of functions, they are both well suited for a wide range of practical and educational activities. Atari Planetarium is an upgrade of an earlier program for the Atari XL/XE computers. Skyplot, from Germany, was originally written in 1980 and has since been translated and expanded over several subsequent generations of computers.
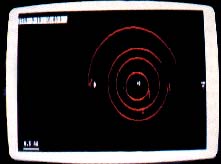 |
Skyplot screen taken in mid-passage from a simulation of the orbits of the inner Solar System planets. |
Space: The Final Frontier
The primary function of these programs is to generate a screen display of the night sky for any observation point on Earth, at any date and time. The display contains visible stars, deep-space objects such as galaxies, star clusters and nebulas, planets from our own solar system, the moon and the sun. Constellations such as the Big Dipper or Orion are shown by connecting lines. By supplying your current date, time and geographical location, you can compare the display with the actual night sky and learn to recognize constellations and other landmarks of the heavens. (Editor's Note: To do this, you'll probably need to set up your ST by the window. A more practical approach, however, might be to use a screen dump instead of the screen itself.)
You can also use either program to track the movement of a celestial body and study interesting astronomical events such as eclipses, transits (where a planet passes in front of the sun), conjunctions (where two or more planets appear next to each other in the sky) and more. Taken to extremes, you can watch the shapes of constellations change over time or the polestar change from Thuban (in ancient Egyptian times) to Polaris (today) and Gamma Cephei (around A.D. 4145).
Atari Planetarium
Planetarium runs on any ST or Mega in either low or high resolution. It is not copy-protected and can be installed on a hard drive. The program follows normal GEM protocols and is both mouse- and keyboard-driven. The accompanying manual is excellent, one of the best I've ever seen. It is well-written, logically organized and has numerous screen shots, illustrations, examples and information for self-study or classroom use.
Planetarium's basic function is to calculate and display a star chart for any date and time from 9999 B.C. to A.D. 9999. By moving the mouse cursor over a map of the world, you can select an observation point. While the map is not accurate enough to obtain a precise location by mouse-clicking, you can get reasonably close and then use a screen icon to lock into the nearest minute of latitude and longitude. A table of geographic coordinates for over 150 cities and islands is given in the manual.
The star chart is drawn from a database of over 3,500 stars and 300 deep-space objects. Options include showing the connecting lines and three-letter names for constellations, symbols for the solar system planets and a grid of celestial coordinates. Planetarium shows the sun as a circle and the moon is shown with its current phase (ea. full moon, crescent, etc.). The display works best in color because the background tracks the time of day: black at night, lightening at dawn and bright blue during the day.
The normal display view mimics that of an observer looking out toward the horizon. An altemate view mode shows the sky as a typical astronomical chart, looking straight up to the celestial north pole. The view magnification can be varied by a factor of two over four levels--good for focusing on specific events such as a solar eclipse where you can actually watch the moon's shadow pass over the sun.
Alongside the display chart is a control panel where you can change the date time and viewing angle; the display is updated within seconds. Using the find menu, you can quickly locate the sun, moon, a planet or any of 88 constellations and have the display redrawn to be centered about it. Halley's comet can also be located, but only over the limited time window of its last approach during 1985-86.
 |
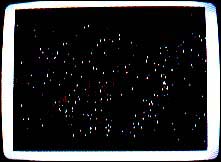
Planetarium screen taken in mid- passage from a simulation of a solar eclipse that occurred in 400 B.C., visible near Rome. |
The mouse pointer can provide two types of information. first, click the right button while positioned on a star or object to open a text window at the bottom of the screen. This window gives the star's name and description (if available). Click the left button on any position in the display to show the star's corresponding azimuth and elevation in the control panel area.
The strongest feature of Planetarium is its abiliy to change the display to reflect the passing of time. The clock can move at real-time or up to 64 times faster, either forward or backward in time. This lets you set up conditions prior to an eclipse or other event, then watch it happen on the screen as it would be seen from Earth. This is an outstanding function for educational applications. The manual gives a number of astronomical events--historical and those yet to come--that can be studied via this simulation approach.
Skyplot
While Planetarium was created with the backing of Atari, Skyplot has been a labor of love by a single programmer and incorporates a number of advanced features for the astronomy hobbyist. It uses several data files to encompass nearly 16,000 stars and 1,053 deep-space objects. Because of this large database and the number of features, Skyplot requires at least one megabyte of memory. It runs in both medium and high resolution and is not copy-protected. The manual is very comprehensive with many examples, but has no screen shots or index.
The data is stored initially in three files: normal stars, alternate stars and deep-space objects. Be prepared for a long wait--about 20 minutes--the first time you load them; a program option subsequently lets you save the data in a single compressed file. After I installed the program and compressed data files on a hard drive the load time was reduced to a mere 20 seconds! The original data files are in ASCII format and you can augment them, then resave them in the manageable compressed format.
There are three menu headings: Settings, Display and Search. An online Help function includes cross-references to the appropnate manual sections. Skyplot follows standard GEM protocol, but I found the mouse response to be somewhat sluggish.
The home screen lists the current display settings, which include observer geographical position, date/time, screen colors, type of star chart to create, classes of stars and objects to show. Observer site can be entered directly through a dialog box or by picking a position from a display of the Earth. That display can be rotated and zoomed in through several magnifications for reasonably accurate positioning. The time window is restricted to A.D. 1583 through 3000.
Several different star chart formats are supported. A 3D view can be drawn giving left- and right-eye views on the same screen, but this only works for those people who can cross their eyes properly. The program would achieve the 3D effect much better if it supported the Stereotek 3D glasses.
Display screens can be saved in DEGAS format and you can create and replay a series of screen shots with a companion program included on the disk to provide an animation sequence. The star charts displayed by Skyplot are static, so changes to the settings must be made on the home screen before you can update and redisplay the chart. There is no provision for synchronizing the display to time passage automatically.
 |
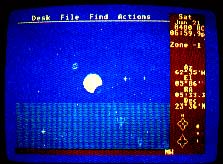
At left, a Planetar- ium screen of the night sky view from Baltimore, MD on October 29, 1988. A gibbous moon is seen rising at the bottom of the screen. |
Given the vast number of stars and objects in its databases, Skyplot can produce extremely dense charts. The charts can be thinned out by selecting only certain groups of stars or objects to display (ea. stars only of visible constellations, planets, galaxies, globular nebulas, etc.). You can also superimpose a grid of celestial coordinates, limit the stars to display on the basis of the apparent magnitude and use the mouse to select a display area for zooming in.
The zoom function is useful when depicting events such as eclipses or transits. Increasing the size of the sun to large scale lets you see the moon's shadow crossing it during an eclipse or Venus crossing in front of it in a transit. Planets are typically represented by their astronomical sign in the star displays; increasing the magnification lets them take on actual spherical images (ranging from full disks to crescents) for more realism.
A great deal of information is available for many stars and objects. Click the right mouse button on an object to bring up a descriptive text box. If the object is a star from a constellation, the constellation connecting lines will be shown and you can remove them by clicking the mouse.
The Search command helps you locate stars and objects. It activates a dialog box where you can enter a text string with the full or partial name of the object. The success of the search depends on how closely you can match the name: "androm" was readily picked as the Andromeda galaxy, but no match was found for "little dip."
Where Skyplot really comes into its own is with its advanced features, such as a simulation of planetary movement in the solar system, either as an animation or by tracing the movements over a star chart. You can also generate a statistics summary of the star distribution, by magnitude in the current display. Another feature produces a chart of visibiliy for all planets over the current year to predict the best observation periods. The rising and setting times can be computed for any object, including the maximum height of apparent rise and the time it occurs.
 |
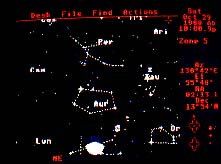
Skyplot screen of the same sky. Contrast this with the similar view from Atari Planetarium (above) to see the greater detail in Skyplot. |
The occurrence of eclipses, transits and conjunctions of solar system elements can be computed also, and the program is equally facile at generating star charts of the heavens from objects in space--ever wonder what the constellations would look like from Alpha Centauri?
Information on Halley's, Wilson's and Kohoutek comets is included so that they can be mapped and studied like planets or deep-space objects. One example simulation is for the 1908 approach of Halley's Comet past Earth. Movements of objects not specifically programmed into Skyplot, such as asteroids or other comets, can be computed and shown if information on the orbit characteristics is supplied. One such example is predefined in the program for the asteroid Ceres.
If You Have a Choice. . .
Although these two programs can do basically the same thing, there are a number of differences in implementation. Atari Planetarium is better suited for the casual user and as an educational tool at the elementary through high school levels. It works with all ST models, has a superior interface (it can change setting parameters directly from the star chart display) and can lock the display to synchronize with passing time. My elementary school-age children were able to use the program easily and follow the examples in the manual to simulate solar eclipses and do other astronomical "experiments." My only real gripe is that Halley's comet is only included for the 1985-86 pass; this should be expanded to work over larger time periods.
On the other hand, serious hobbyists will want to use the advanced features found in Skyplot. Although the time window is much narrower, the range of observations is much broader (including star charts from the point of view of other worlds) with superior graphics, particularly at high magnification. The drawbacks are the computer memory requirement and that the display cannot be synchronized to update with passing time. Animation can be done in a stepwise fashion or through a series of screen shots played back by an auxiliary program. This program also has educational value but is geared more toward the high school level.
Contributing Editor Jim Pierson-Perry is a research chemist and semi-professional musician. He lives in Elkton, Maryland.
PRODUCTS MENTIONED
Atari Planetarium $39.95. Atari Corp., 1196 Borregas Avenue, Sunnyvale CA 94086, {408} 745-2000.
Skyplot, $99.95, Robtek Ltd. (USA), 1983 San Luis Avenue, Suite 24 Mountain View, CA 94043, (415) 968-1345.