THE OSI® GAZETTE
Double-Density Graphing On The O.S.I. C1P
Gary Boden,
Narragarrsett, RI
When analyzing data or trying to understand an algebraic equation, a quick X, Y plot is often an invaluable first step. The O.S.I. C1P, despite its extensive graphics character set, doesn't particularly lend itself to graphing because of its cramped 24 × 24 video format.
One way to ease the crowding and double the resolution of a plot is to make use of graphics symbols that divide each square into quarters. I've written a program in BASIC that does this quickly and neatly (Fig. 1). As written it can stand by itself or, with slight modifications, function as a subroutine called up by a number-crunching main program. The effective display is increased to 40 × 40 bringing it into the range of usefulness for many scientific and business applications.
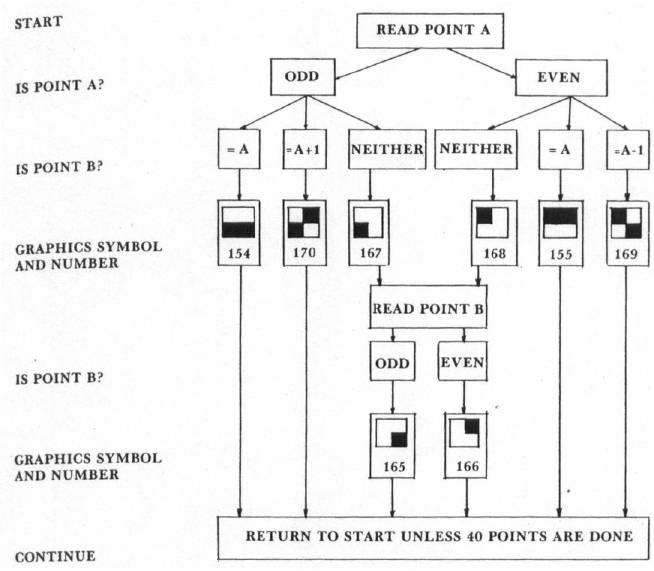
The program is designed first to scale the input data array, DA(I), between 0 and 40 (lines 5260 -5332) and put the results into array DY(I). Datasets with a difference between maximum and minimum values of more than 40 are condensed and smaller ones expanded on the graph. Both positive and negative values now will be plotted above the X-axis. Actual high (YH) and low (YL) values are saved and printed by line 5900 to give an idea of absolute as well as relative magnitudes. Next, 40 locations on the video display are computed for the scaled points. This must be done two points at a time because several symbols can be used to represent the pair, depending on whether they are equal, different by ± 1, or neither. Lines 5340 - 5780 code for the selection of the correct symbols. Figure 2 shows a decision tree that depicts how the choice is made. Since the first point of the pair automatically has an odd X-value (1, 3, 5, ...39) and the second an even value (2, 4, 6,...40), only Y-values need be evaluated as odd or even. Based on the following table of possible X, Y coordinates, the correct quadrants are chosen for each square:
| QUADRANT | STATUS | EXAMPLE |
| LEFT BOTTOM = | X ODD, Y ODD | (1, 1) |
| LEFT TOP = | X ODD, Y EVEN | (1, 2) |
| RIGHT BOTTOM = | X EVEN, Y ODD | (2, 1) |
| RIGHT TOP = | X EVEN, Y EVEN | (2, 2) |
Line 5800 computes the video display locations rounded to the nearest integer.
The axes are drawn by lines 5210 - 5252. I also include a background grid (lines 5100 - 5130) to help read the plotted curve, but this may be deleted easily if not needed. The purpose of lines 6000 - 6030 is to check for a "return" that when found causes a recycling to the start.
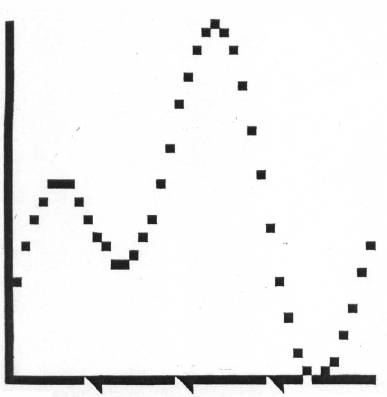
None of this would be any good without a curve to plot. Line 210 is where the user enters his equation (or READ statement for data input) before running the program. DA(I), the data array, remains unaltered in case it is needed elsewhere. Any number of variables supplied by the user and/or program may be used so long as they are assigned before line 210. Figure 3 shows a graph of DA(I) = SIN(I/X)-COS(I/Y) where X = 3, Y = 6.3, and I goes from 1 to 40. Note that the scaled value of the 34th point is zero and that a blank spot is placed on the X-axis under the previous point.
The program occupies about 1700 bytes of RAM, but by dropping all the extras — remarks, header, instructions, etc. — it can fit into about 1 K of memory. Running time is around 8 seconds, much of it spent scaling and drawing the background; the curve plots out rapidly.
Four extensions of this routine come to mind which you may want to make to adapt it for your own purposes:
- adjust axes to show negative plot quadrants
- overplot more than one curve on the same graph
- extend the X-axis with a second plot showing points 41-80
- fill in below the curve to make a bar chart
In conclusion, this routine takes a big step toward relieving the C1P's small display problems when graphing. It is compact and quick, leaving plenty of memory to use for other things.
10 REM--DOUBLE-DENSITY GRAPHING ON THE C1P
20 REM--BY G. BODEN; 9 DEC 1980
30 REM--ENTER YOUR EQUATION ON LINE 210
40 REM--THE Y-AXIS IS AUTOMATICALLY SCALED FROM 0 TO 40
50 REM--AND 40 POINTS ARE PLOTTED ON THE Y-AXIS
60 FOR I = 1 TO 25 : PRINT : NEXT
65 PRINT "************************"
70 PRINT "DOUBLE-DENSITY PLOTTING"
72 PRINT "ON THE O.S.I. CHALLENGER"
74 PRINT "************************" : PRINT : PRINT
80 PRINT "HIT ‘RETURN’ AFTER PLOT TO RECYCLE TO BEGINNING" : PRINT : PRINT
100 DIMDA(50) : DIMDX(50) : DIMDY(50)
120 INPUT "ENTER X" ; X
130 INPUT "ENTER Y" ; Y
200 FOR I = 1 TO 40
210 DA(I) = SIN(I/X) - COS(I/Y)
220 NEXT
4900 REM--DRAW THE GRAPH AXES AND REFERENCE POINTS
5000 FOR I = 1 TO 25 : PRINT : NEXT
5100 G2 = 53446 : FOR J = 1 TO 20
5120 FOR I = 1 TO 20
5125 POKE G2 + I, 207 : NEXT I
5130 G2 = G2 + 32 : NEXT J
5210 FOR G = 53446 TO 54054 STEP 32
5220 POKE G, 15 7 : NEXT
5230 G = 54086 : FOR I = 1 TO 20
5240 POKE G + 1, 155 : NEXT
5250 POKE G, 166
5252 T = 177 : POKE G + 5, T : POKE G + 10, T : POKE G + 15, T
5255 REM--SCALE THE DATA
5260 YH = DA(1) : YL = YH
5270 FOR I = 1 TO 40
5280 IFDA(I) > YH THENYH = DA(I)
5290 IFDA(I) < YL THENYL = DA(I)
5292 NEXT
5300 YR = YH - YL
5305 NF = 0 : IFYL < 0 THENNF = ABS((YL/YR) * 40)
5310 FOR I = 1 TO 40
5320 DX(I) = I
5330 DY(I) = INT((DA(I)/YR) * 40 + NF +.5)
5332 NEXT
5335 REM--PLOT OF CURVE
5340 I = 1
5500 IFINT(DX(I)/2) * 2 > = DX(I) GOTO 5670
5510 IFINT(DY(I)/2) * 2 = DY(I) GOTO 5600
5520 IFDY(I) <> DY(I + 1) GOTO 5550
5530 SY = 154 : GOSUB 5800
5540 GOTO 5750
5550 IFDY(I) <> DY(I + 1) - 1 GOTO 5580
5560 SY = 170 : GOSUB 5800
5570 GOTO 5750
5580 SY = 167 : GOSUB 5800
5590 GOTO 5670
5600 IFDY(I) <> DY(I + 1) GOTO 5630
5610 SY = 155 : GOSUB 5800
5620 GOTO 5750
5630 IFDY(I) <> DY(I + 1) GOTO 5660
5640 SY = 169 : GOSUB 5800
5650 GOTO 5750
5660 SY = 168 : GOSUB 5800
5670 DY(I) = DY(I + 1)
5680 IFINT(DY(I)/2) * 2 = DY(I) GOTO 5710
5690 SY = 165 : GOSUB 5800
5700 GOTO 5750
5710 SY = 166 : GOSUB 5800
5750 IFINT(DX(I)/2) * 2 > = DX(I) GOTO 5770
5760 I = I + 1
5770 I = I + 1 : IFI > 40 GOTO 5900
5780 GOTO 5500
5800 POKE G + INT((DX(I)/2) + .5) - 32 * INT((DY(I)/2) + .5), SY : RETURN
5900 GOSUB 6000
5910 PRINT "HI = " YH ; "LO =" YL
5920 GOSUB 6000
5930 GOTO 120
5990 REM--LOOK FOR <CR>
6000 POKE 530, 1 : K = 57088
6010 POKE K, 223 : IFPEEK(K) = 247 THEN 6030
6020 GOTO 6010
6030 POKE 530, 0 : RETURN
6040 END