Math Graphics For Atari ST
Len Cortigiano
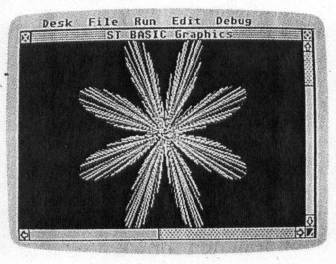
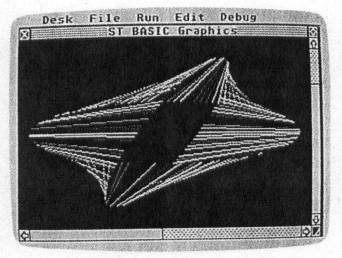
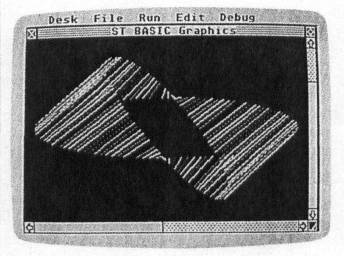
Colorful lines swirl about the screen in these two graphics demos. The shapes will fascinate children of all ages. And if you're a BASIC programmer, you'll learn how the technique of color cycling works. For all STs with a color monitor (low resolution only).
For as long as I've been using computers, I have been fascinated by their graphics capabilities. When I read the article "Amiga Math Graphics" (which itself was a modification of an Apple II graphics program) in the October 1986 issue of COMPUTE!, I wanted to see it run on my Atari ST.
"Math Graphics" uses the trigonometric sine and cosine functions to draw colorful, symmetrical shapes. Translating the program from Amiga BASIC to ST BASIC was fairly easy. A useful feature of both BASICs is the ability to GOSUB to named subroutines. For example, GOSUB INITIALIZE is easier to remember than a line number, and it has more significance. The ST program requires some VDISYS and GEMSYS commands, two powerful features of ST BASIC, to include a simple animation routine in the second demo program.
Both programs run in the 16-color low-resolution mode to make them as colorful as possible, and also because all 16 color palettes are needed for the color cycling which produces the animation. If your ST isn't already set for low-resolution mode, use the Preferences menu option to switch to low res before you activate ST BASIC.
Important: If you're using an older 520ST, which requires you to load the TOS operating system from disk, be sure to turn off ST BASIC's buffered-graphics option to free up enough memory for these programs. (To turn off buffered graphics, drop down the Run menu in ST BASIC and click once on the Buf Graphics item.) If your computer has TOS in ROM (as do all STs manufactured after 1985), this step isn't necessary.
How It Works
The key to both programs is the LINEF command, which draws a line between two points. The trick is figuring out a series of endpoints which result in an interesting graphics effect.
The locations of the lines are calculated using polar coordinates. You may be familiar with the Cartesian system, which describes a point in terms of an x coordinate (the horizontal distance from the origin point) and a y coordinate (the vertical distance). In the polar system, a point has a distance from the origin point (variable R in the program) and an angle (variable Theta). For the purposes of this program, polar coordinates are easier to handle.
Both programs start by checking whether the computer is set for low resolution by PEEKing memory location SYSTAB, an ST BASIC reserved variable. If the computer is in medium-res or hi-res mode, an alert box opens on the screen and prompts you to switch resolutions. Click on the OK button and use Set Preferences from the Options menu on the GEM desktop to enter the low-resolution mode (note that this requires a color monitor).
Once the programs are sure the ST is in low-resolution mode, they go to MATHGRAPHICS, the main loop label for both programs. Here, the RECORD subroutine is called to store the original color palette in the array OLD%. This is done so that the original values can be restored when the program is finished.
Next, INITIALIZE is called, and it, in turn, branches to three other subroutines: TITLEBAR, to place a custom title on the output window; HIDEMOUSE, to disable the mouse pointer so it can't spoil the pictures; and WIPE, which uses a VDI routine to paint the screen black much faster than BASIC's FILL command can.
Next, the random generator is seeded with a zero to insure a different sequence of colors each time the program is run (Program 1 only).
Finally, the values of constants Pi and TwoPi are set, and DEF FN is used to set up the polar-to-Cartesian functions. The program uses polar coordinates, but the ST's screen is laid out in a standard x,y grid. The FNPolarX and FNPolarY functions do the translating.
Color Cycling
In Program 1, the main loop cycles through eight modules, each one producing a different shape. Before each line is drawn, a different color is selected at random from the ST's current palette. For more variety, you might want to try adding a subroutine at the beginning of the program to select a new palette at random from the 512 colors available on the ST. PAUSE holds the image on the screen for a few moments, and WIPE is called again to quickly erase the picture before the next one is drawn.
Program 2 goes through the same eight modules and draws the same shapes, but selects colors from the palette in sequential order from 2 to 15. Colors 0 (white) and 1 (black) are not used, since using white would cause the window borders to change colors during the animation and using black would cause the background to change color.
After each shape is drawn, the ANIMATE subroutine takes over, changing all the available colors to black using the BLACKOUT subroutine. The picture seems to disappear. One by one, individual lines are "turned on" with cyan, and "turned off" with black, by alternately calling the BLUES and BLACKOUT subroutines while stepping through the 14 color palettes. Duration is set by the value of the variable Cycle, using a WHILE-WEND loop to count down to zero. At zero, the subroutine PLAYBACK is called to restore the original color palette before going on to the next shape.
In both programs, after all eight shapes have been drawn, the screen is cleared and a dialog box is opened. Click on the RE-RUN button to run the program again or on the QUIT button to abort. Quitting the program clears and then closes the output window before the program ends.
For instructions on entering these programs, please refer to "COMPUTE!'s Guide to Typing In Programs" elsewhere in this issue.