Mandelbrot Graphics For Commodore
Steven M Thorpe
A mathematics phenomenon known as the Mandelbrot set can provide the basis for some stunning computer graphics. The following programs make it possible to generate a wide variety of colorful high-resolution images which can be saved on disk for future viewing. The programs work on any Commodore 64 (or 128 in 64 mode).
One of the most beautiful features of the Commodore 64 is its multicolor bitmap mode, which lets you create detailed high-resolution images using several colors. We're all familiar with the many drawing programs that work like video paint boxes, letting you draw directly on the screen. But the computer can create beautiful, highly intricate images all by itself, using relatively simple mathematical methods. "Mandelbrot Graphics For Commodore" allows you to generate interesting hi-res pictures, save them to disk, and reload them at any lime.
Creating Screens
<>Type in and save Program 1. When you run the program, it immediately clears the hi-res screen and begins to draw an image based on the Mandelbrot set (see below). You'll need to be patient: A full-screen hi-res image takes a long time to create. Although the program uses machine language routines to clear the hi-res screen, the drawing computations are done in BASIC.In multicolor bitmap mode, up to four different colors can be displayed in each character position. Distortion occurs if a program calls for too many colors in a single position. Since you can have only one screen background color at a time, each character position is actually limited to three independent colors. While this may seem a severe restriction, spectacular graphics are still possible. Program 1 selects an available color memory source (not yet used in the current character position unless used for the current color), and then sets the appropriate color code and bit pattern to display that color.
If you're impatient for results and don't mind viewing a smaller image, replace lines 180 and 190 with these lines (be sure you've saved the original version of the program before you make this modification):
180 FOR X0=XL TO XR STEP (XR-XL)/159*2
190 FOR Y=YT TO YB STEP (YB-YT)/199*2
With this change, Program 1 draws an image about one-fourth the size of the screen, in roughly one-fourth the time it would take to draw a full-screen picture. To change back to a full screen, retype lines 180 and 190 as listed in Program 1. This can be useful when modifying the program to produce different results. You can view the results in a reduced scale to save time, then draw it at normal size to be saved to disk. Press RUN/STOP-- RESTORE if you need to break out of the program.
The variables XL and YB play a crucial part in defining what the final image looks like. XL sets the left boundary of the Mandelbrot set and YB sets the bottom. Similarly, XR defines the right boundary and YT defines the top. By changing the values of XL, YB, and SR, you can "zoom in" for a closer look at any given area of the Mandelbrot set. You don't need to worry about the value of YT: The program automatically gives YT the value needed to shape the screen image correctly.
Line 170 contains color codes used for various parts of the image. Changing these numbers alters the colors used in the display (see your user's manual for an explanation of color codes). Lines 222--230 shape the zones for each different color. In line 120, the variable SM determines the spacing between different colors, and CT controls how much detail is shown. Remember, using too many colors in zones of rapid color change can lead to excessive color distortion. Together, the variables SM and CT affect how long it takes to complete a Mandelbrot image.
Invisible Lines Of Power
Programs 2 and 3 contain modifications for Program 1 which generate different displays based on the unseen forces of nature. To use these programs, you must already have a copy of Program 1. To enter Program 2, first load Program 1 into memory, then type in the lines listed in Program 2 (they will replace lines 100--240 of the original program). When that's done, save the program using a different filename from the one you used for Program 1.
Program 2 uses the color schedule to paint patterns that resemble the magnetic lines of force between two wires charged with electricity. Displays of this type make it easier to visualize forces such as electromagnetism, which are invisible to the naked eye, yet have a profound effect in the world around us. Of course, you can enjoy the displays even if you don't understand the scientific concepts involved in these simulations.
You can also modify Program 2 to produce different effects. Change the values of variables I1 and 12 to see what the magnetic pattern is like for various current levels. For instance, if you set I1 to 25 and 12 to -100, the program displays an opposed current flow with one current four times as large as the other. Larger current levels cause closer flux lines, more detail, and a greater chance of color distortion.
To enter Program 3, load Program 1, type the lines listed for Program 3, then save the entire program under a unique filename. Program 3 simulates another invisible, yet powerful force of nature-- the interaction of gravitational forces between the earth and the moon. The black region on the right is the zone of gravity equal to that at the surface of the moon. The program accurately draws the moon to scale relative to the gravitational potentials in effect.
Line 120 of Program 3 positions the earth and moon relative to the upper left-hand corner of the screen, using an r,y coordinate scheme in which the screen has horizontal positions 0--159 and vertical positions 0--199. The earth can be shown by assigning it a value on the screen. You can create an interesting image by placing the earth at coordinates 53,99 and the moon at coordinates 106,99.
The variable F determines which color is plotted. F represents the gravitational force (measured in Newtons) on a stationary one-kilogram mass. Variable DE represents the distance from earth, and DM signifies the distance from the moon. The region close to the moon was made one color because it has such a steep gravitational gradient that there would be excessive color distortion if it were not specially treated.
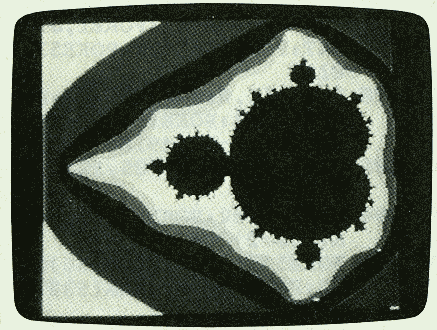
"Mandelbrot Graphics For Commodore"
creates detailed hi-res images based on an unusual mathematics
technique.
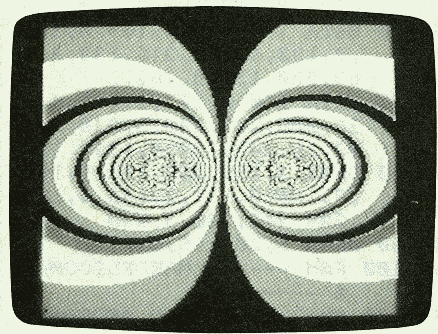
This image simulates the lines of
electromagnetic force surrounding two electrical conductors.
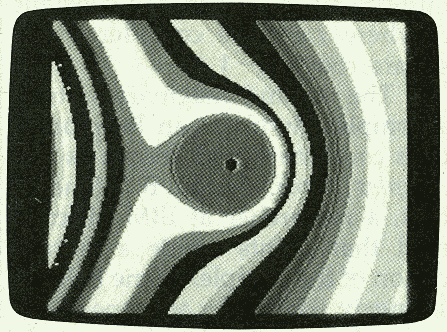
This pattern is created by a program
that represents the gravitational forces around the earth and the moon.
Saving And Loading Screens
After you create a screen, it's easy to save it on disk for future use. Simply press S after the image is completely drawn. Before saving an image, make sure that the disk drive contains a disk with at least 40 blocks free. Three different memory areas must be saved in separate disk files to reconstruct the image accurately.
To avoid spoiling the image with a printed prompt, the program switches temporarily to a text screen to allow you to enter a filename (which should contain no more than 12 characters). The program then manipulates the name you enter to create distinct filenames for the three files necessary to store all the picture information. The prefix M- is added to the filename you specified for the first file. This file contains the hi-res bitmap of the image. For the next file, the suffix S is added in addition to the M- prefix. This file contains the screen memory for the image. Finally, for the third file, the suffix SC is added in addition to the M- prefix. This file contains the color memory for the image.
Choose your filenames carefully; the program erases any existing files with the specified filename before it stores the new files. Thus, if you accidentally reuse an existing name, you may overwrite a previously saved masterpiece.
After you enter the filename, the program switches back to the hi-res image while the screen is being saved.
Program 4 loads the stored image from disk and displays it on the screen. When you run this program, it asks you to enter a filename. Give the filename you specified when you saved the image with Programs 1-3. Don't worry about the prefixes and suffixes; Program 4 takes care of these and loads all three files necessary to recreate the image.
What Is A Mandelbrot Set?
Although Mandelbrot images have attracted wide interest as a means of generating graphics, the origin of these pictures lies deep in the realms of mathematics and engineering. In brief, certain engineering problems require the use of complex numbers. A complex number consists of two parts: a real part and an imaginary part. The real part of the number is like the numbers we use every day. For the imaginary part, special rules of multiplication apply. For instance, if you square the imaginary part of a complex number, the result becomes negative and real. Thus, imaginary numbers are often written in engineering calculations as a real number multiplied by the constant i, where i can be considered the square root of -1.
The real and imaginary parts of a complex number can be plotted on a coordinate grid known as the complex plane. Benoit B. Mandelbrot, a researcher at IBM, discovered that points inside a certain region of the complex plane behave strangely when they are repeatedly squared and the result of each squaring is added to the original point. Some points get large rapidly, while their near neighbors grow slowly. Other neighboring points don't grow at all. As the process is repeated, these tendencies are accentuated. The region where these strange results occur is called the Mandelbrot set after its discoverer.
While Mandelbrot sets have certain practical applications, they can produce striking results when you translate the numeric values into different-colored points on a computer screen. These programs color each point on the hi-res screen according to how fast it grows during the iterative (repetitive) process. Computing the entire set requires an enormous number of calculations, so all of these programs take some time to complete--many hours in some cases. You may want to start a program running at bedtime so the picture will be finished by the next morning. (There's no need to leave the monitor on all night, of course.)
If you'd like to photograph a finished image, shoot the photos in a darkened room to eliminate screen glare. Load a single-lens reflex camera with medium-speed film (ISO 100 works well), mount the camera on a tripod, attach a cable release, aim the viewfinder squarely at the screen, and use a very slow shutter speed--no faster than 1/4 second. If your camera has an automatic exposure mode or a built-in light meter, it should indicate a lens aperture of f/8 to f/16.