A Monthly Column
Friends Of The Turtle
David D. Thornburg
Associate Editor
A Fractal Of My Former Self...
As I was going to St. Ives,
I met a man with seven wives.
Each wife carried seven sacks;
And in each sack was seven cats;
And with each cat was seven kits.
Kits, cats, sacks, and wives,
How many were going to St. Ives?
If you remember this puzzle from your childhood you probably remember that the answer is one.
Well, that may not be very exciting; but suppose you are walking to St. Ives and you want to know how far it is from some other location – Here, for example. The first thing we might do is look at a map.
From the map we see that St. Ives and Here are both coast towns located near bays. In between, the coast juts out to sea.
Figure 1.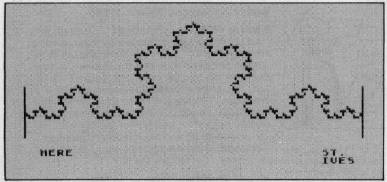
How long is the coastline between the towns of Here and St. Ives? If we set a pair of dividers to span the distance between the two towns we get one measurement. This distance is one kilometer.
Figure 2.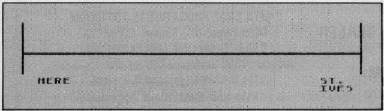
But this path doesn't take us along the coast. If we set our dividers to measure in units of 1/3 of a kilometer, we can trace a path which more closely follows the coastline.
Figure 3.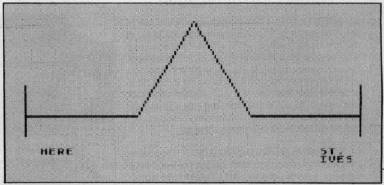
By counting each 1/3 kilometer increment we can see that this path is 4/3 kilometer in length. Next, let's set the dividers to 1/9 of a kilometer and measure the distance again.
Figure 4.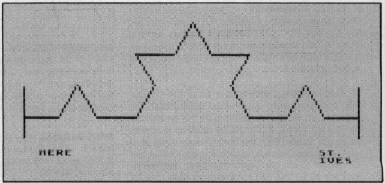
This looks more like the actual coastline and gives us a distance of 1/3 kilometers. Since we replaced each straight line in Figure 3 with a replica of Figure 3, we can see that the length of the coast in Figure 4 can be written as 4/3 * 4/3.
Now let's set the dividers to 1/27 of a kilometer and measure again.
Figure 5.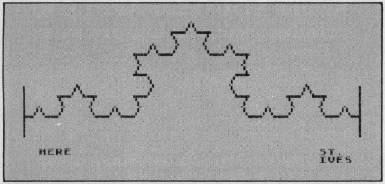
This brings us even closer to the coastline and gives us a distance of 4/3 * 4/3 * 4/3 or 64/27 kilometers – more than twice our original estimate.
By now it should be obvious that each time we reduce the setting of our dividers by 1/3, the path length increases by a factor of 4/3. If we were to walk along the coast by following every nook and cranny, the distance would be 4/3 * 4/3 * 4/3 * 4/3 * 4/3,... etc. In other words, the length is infinite.
The reason for this is that each part of the coastline is an infinite set of replicas of the overall shape shown in Figure 3: If you were to look at a high magnification view of the coastline it would be just as bumpy as a lower magnification view.
Real coastlines don't have infinite lengths, of course, but our imaginary coastline does because it is made from a type of self-similar curve called a fractal. Mathematical expressions of this type have been known for some time but were not studied much because mathematicians thought their properties were too strange. For an insight into just how strange these functions are, you might want to look at the book Fractals: Form, Chance, and Dimension by Benoit Mandelbrot (Freeman 1977). This book discusses the properties of curves such as the one I chose for the imaginary coastline. This function is called a Triadic Koch curve and was discovered by von Koch in the early 1900's.
Mandelbrot's book provides an interesting glimpse of this strange mathematical world, but is quite frustrating in that he doesn't show the reader how to express these curves so that a computer could draw them.
Have you guessed that the turtle might hold the key to drawing fractals?
First, let's look at Figure 3, since this is the basic building block from which all the other curves are made. A procedure for creating this figure is shown below in both Apple LOGO and Atari PILOT. (This also lets you see the similarities and differences between these two languages.)
| Apple LOGO | Atari PILOT |
| TO F0 : SIZE | *F0 |
| FORWARD : SIZE | GR: DRAW #A |
| LEFT 60 | GR: TURN -60 |
| FORWARD : SIZE | GR: DRAW #A |
| RIGHT 120 | GR: TURN 120 |
| FORWARD :SIZE | GR: DRAW #A |
| LEFT 60 | GR: TURN -60 |
| FORWARD : SIZE | GR: DRAW #A |
| END | E: |
If you move the turtle to the left edge of the screen and turn it to face right, then, by using the procedure F0, a replica of the curve in Figure 3 should appear on your display. For a line length of 81 units (a good size for Apple LOGO) you would type F0 81. In Atari PILOT you might want to use a line length of 54 units (because of screen resolution differences between the Atari and Apple graphics). To do this, just type:
C:  #A = 54
U:  *F0
and you should see a curve similar to that in Figure 3.
Now, what about Figure 4? In our coastline, each straight line section is replaced with a copy of Figure 3 which has been reduced by one-third. Let's call the procedure to do this F1.
| Apple LOGO | Atari PILOT |
| TO F1 :SIZE | *F1 |
| F0 : SIZE/3 | U : *F0 |
| LEFT 60 | GR : TURN-60 |
| F0 : SIZE/3 | U : *F0 |
| RIGHT 120 | GR : TURN 120 |
| F0 : SIZE/3 | U : *F0 |
| LEFT 60 | GR : TURN-60 |
| F0 : SIZE/3 | U : *F0 |
| END | E: |
Suppose we next want to draw the next level of this curve. All we need to do is create a copy of F1 (called F2) in which references to F0 are replaced by references to F1. Each time this procedure is used it will use F1 which will use F0. If you follow this process a few more times, you might make a procedure called F20 which uses F19, and so on.
How far do we need to go? If our original curve (Figure 3) used a line length of 27, for example, then each line should be 9 units long for F1, 3 units long for F2 and 1 unit long for F3. Since the display can't show lines less than 1 dot long, it hardly makes sense for use to try to make this curve with any finer resolution.
In a future column we will show how LOGO lets you create these curves with just one procedure. Meanwhile, you can test your abilities by using a different figure as a starting pattern:
Figure 6.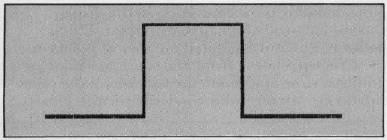
Because of the 90 degree turns in this figure, those of you with WSFN will also be able to make this fractal curve.
Here is the first procedure you will need:
| Apple LOGO | Atari PILOT |
| TO F0 :SIZE | *F0 |
| FORWARD : SIZE | GR: DRAW # A |
| LEFT 90 | GR: TURN-90 |
| FORWARD : SIZE | GR: DRAW # A |
| RIGHT 90 | GR: TURN 90 |
| FORWARD : SIZE | GR: DRAW # A |
| RIGHT 90 | GR: TURN 90 |
| FORWARD : SIZE | GR: DRAW # A |
| LEFT 90 | GR: TURN-90 |
| FORWARD : SIZE | GR: DRAW # A |
| END | E: |
In WSFN you would create the procedure *A this way:
= *A(F6RF2RF2RF6RF)
(You might want to have the turtle move forward more with each step for the first few levels so you can see what is going on more easily.)
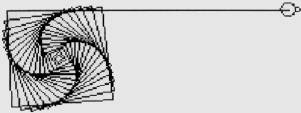
Here is what you should get for your final picture:
Figure 7.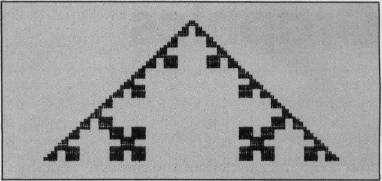
Keep experimenting with other patterns – and let me know how you are doing.