V-Graph
Pro-quality visual punch for your reports
By ALFRED FILSKOV III
V-Graph draws professional-looking business or school graphs-bar, line, or point graphs-that you can display save and print. This straightforward, useful graphing program also accepts data from VisiCalc spreadsheets. The BASIC program works on all 8-bit Atari computers having at least 48K memory and a disk drive.
Let your 8-bit Atari help you get through your next important report or presentation. V-Graph is a graphing program for business or school that stands comparison to many professional packages running on "business computers." It creates, displays and prints impressive bar graphs, line graphs, or point graphs-and it can use data from VisiCalc spreadsheets.
If you don't have VisiCalc, type in the numbers with a word processor, such as PaperClip or AtariWriter Plus. To word-process a data file for use with V-Graph, you only need to follow two rules. 1. All the data numbers in your file must be in a single column. 2. the last digit of each number must be exactly 11 spaces right of the left margin. Therefore, your file would look something like this:
        887
       2745
         91
      13019
        562
       6473
In its present form, V-Graph does not work with SynCalc (Broderbund) or A-Calc (Antic Catalog) spreadsheet software. If you program a conversion patch, please send it to Antic to be considered for possible publication.
Also, V-Graph's current graphics dump routine was written to work with Epson-compatible printers. However, at Antic, we sucessfully got V-Graph printouts with the Epson FX-85, C. Itoh M-8510, Gemini 10X and Star Micronics SG-10 and SG-15. If you want to substitute your own graphics dump routine, put it at lines 670-710.
USING THE PROGRAM
Type in Listing 1, VGRAPH.BAS, check it with TYPO II and SAVE a copy before you RUN it.
If you use VisiCalc to create columns of data for graphing, be sure to save the data to disk with the /PF (print to file) option. First, position the cursor at the top of the first data column on the spreadsheet. Type in the command /PF and type in a filename at the prompt (but leave out the extender). When prompted for "lower right," move the cursor to the bottom of the data column and press [RETURN]. Repeat these steps for each data column.
V-Graph can simultaneously graph as many as three data files containing
up to 100 data points apiece. But each file must contain the same number
of horizontal X-coordinates, and the data values must range beween 0 and
900,000. Negative numbers won't be accepted, nor will non-numeric data
such as spaces or "header" files.
as three data files
containing 100
data points
apiece
Once you have created data files, you can run V-Graph. When the data is loaded and ready to graph, the program will figure a scale for the vertical Y-axis. Then it will ask if you want the horizontal X-axis labeled by letter, month or number. Next, it will ask for a graph title and a label for the Y-axis. If you want neither of these, you can just press [RETURN]. If you are graphing two or three files at once, you must enter labels for each file.
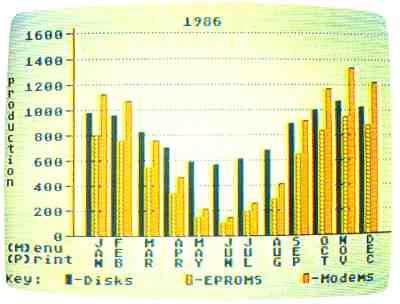
You can draw a line graph, point graph or bar graph, but be aware of the limitations of the bar widths. For example, a three-file bar graph will be squeezed together if it has more than 12 data points per file. This works out well, however, because of the 12 months in a year.
After the graph is drawn, you can either return to the menu or dump the graph to the printer to make a hard copy of your data. Now your professional-looking graphs are ready for that important meeting or report.
Alfred Filskov is a student at North Carolina State University, majoring in industrial engineering
Listing 1: VGRAPH.BAS Download