3-D Fuji
Spin the symbol
by Jerry O'Neill
Even people who aren't fans of arcade games are often attracted by the impressive graphics. Some games, like ZAXXON, have a three-dimensional effect.
This article can't teach you how to program anything like ZAXXON, but it will show you the principles of 3-D drawing with your ATARI. Using the programs listed here, you'll be able to create three-dimensional objects in computer memory, display them on the TV screen, and turn them to any position you choose.
One of these objects is the Atari symbol, known as "fuji," because it resembles Mount Fuji. Another is a barn. But, before we get into the programs, take a minute to review some basics.
THE SCREEN IS LIKE GRAPH PAPER
If you've owned an ATARI more than a few days, you probably realize that the graphics modes treat the TV screen like a piece of graph paper. You use PLOT and DRAWTO commands followed by X and Y values to make pictures. PLOT puts a single point on the screen, while DRAWTO draws a line to the specified point from the last point.
The X values set the horizontal position and the Y values set the vertical position. The top left corner of the screen is 0,0--meaning X = 0 and Y = 0. This is true in every graphics mode.
The largest allowable numbers for X and Y vary, depending on the graphics mode you're using. In GRAPHICS 8 + 16 (GR. 24), the full-screen version of the ATARI's highest resolution mode, the X value for the right-hand edge of the screen is X = 319. The Y value for the bottom edge is Y = 191. Trying to PLOT or DRAWTO positions past X = 319 or Y = 191 will result in ERROR 141, "cursor out of bounds," or ERROR 3, "bad value." (The same if X or Y is less than zero.)
 Figure 1. To show three-dimensional objects
on a flat surface, we can use a synthetic Z axis running at a 45° angle
to X and Y.
Figure 1. To show three-dimensional objects
on a flat surface, we can use a synthetic Z axis running at a 45° angle
to X and Y.Even though the ATARI places 0,0 at the upper-left corner of the screen instead of the center, you'll notice it handles X in the usual way; it grows larger as you move from left to right. But Y acts the opposite of the standard way, becoming larger as you move toward the bottom instead of the top.
This isn't serious. You can change the values of X and Y with simple addition or subtraction if you want to plot Cartesian coordinates on the ATARI screen. What's harder is representing the third, or Z, axis that's required for threedimensional images.
If we could represent the Z axis literally, it would come straight out of the middle of the TV screen. Picturing the screen as a piece of graph paper, imagine that the Z axis is a pencil pushed through the center, at right angles to the paper. Images that were truly three-dimensional would appear to be located at different distances along the pencil--they would have differing Z coordinates.
SHOWING 3-D ON A 2-D SCREEN
Without using holography, we can't show that kind of true 3-D image. To approximate the same effect on a flat TV screen we'll use what you might call a synthetic Z axis, angled at 45 ° to X and Y. In map-making terms, it runs from northwest to southeast. (Angles other than 45 ° can be used, and are, by artists and drafters, but 45° works fine.)
Plotting X,Y,Z coordinates on a flat X,Y screen turns out to be surprisingly simple. If X, Y, and Z are the object's three-dimensional coordinates and TX and TY are the values we'll plot on the screen, then:
TX = X + Z'Fsine(45°) = X + Z*0.707
TY = Y + Z*cosine(45°) = Y + Z':0.707
(The sine and cosine of 45° are the same. )
It's necessary to use these equations for each point, or each corner, of the object being drawn. To test them, we'll create a simple object--a square with the letter "A" on it, with arrows representing the X, Y, and Z axes. If you plot it using the TX and TY equations, it looks like Figure 2a. That's very reassuring; the equations really work!
But it isn't very satisfactory to look at three-dimensional objects from just a single point of view. If a friend hands you something interesting, whether it's the latest Walkman tape player or a new variation on the Rubik's Cube, the first thing you do is turn it over and around, to look at all sides. Ideally, our 3-D graphics program should do the same. And it does.
YAW, PITCH, AND ROLL
Since there are three axes in a three dimensional world, there are three different ways objects can turn. (And, of course, they can turn in any combination of the three.)
Figure 2. This simple demonstration object has arrows marking the X, Y, and Z axes in 2a; 2b, 2c, and 2d demonstrate yaw, pitch, and roll.
Perhaps the movement we think of first is a spinning motion, like a record on a turntable or a child's top. In this case the object is turning on its Y, or vertical, axis. (The Y axis corresponds to the turntable's spindle.) This type of rotation is called yaw (Figure 2b).
Rotation on the horizontal (X) axis is called pitch (Figure 2c), and it's the motion you experience when you're jogging and trip over a crack in the pavement. You pitch forward. In an airplane, pitch is equivalent to climbing or diving.
The third rotation is around the Z axis and is called roll (Figure 2d). Using our piece of graph paper with the pencil stuck through it as an example, if you spin the paper on the pencil, the movement is roll. Probably a better example is a rowboat that's parallel to the wake of a motorboat; as the waves from the wake pass the rowboat, it rolls from side to side. (In fact, sailors have used the terms yaw, pitch, and roll for at least 200 years.)
The bad news about calculating yaw, pitch, and roll movements is that it requires matrix multiplication, a subject not familiar to many of us. The good news is that the matrixes can be boiled down to some pretty simple equations.
If X, Y, and Z are the three-dimensional coordinates for a point on the object, and we want to rotate it, we just use these equations. RX, RY, and RZ are the rotated coordinates.
For yaw
RX = X*cosine(yaw) + Z *sine(yaw)
RY=Y
RZ = Xtsine(yaw) + Z*cosine(yaw)For pitch
RX=X
RY = Y*cosine(pitch) + Z*-sine(pitch)
RZ = Y'Fsine(pitch) + Z'Fcosine(pitch)For roll
RX = X*cosine(roll) + Y*sine(roll)
RY = Xt-sine(roll) * Y*cosine(roll)
RZ=Z
These equations give the new position of the object in three dimensional space. To draw it on our two-dimensional screen, we'll also have to use the TX and TY equations shown earlier.
LET THE PROGRAM DO IT!
The joy of computers is that they will cheerfully do all the tedious math for us and then draw a picture of the results. Listing 1 is an example of a fairly short program that demonstrates this. It will run on a 16K cassette-based ATARI.
The program uses DATA statements to define the object that's shown in the illustrations of yaw, pitch, and roll. It's a square with the letter "A" and three arrows for the three axes, and the program will rotate it any way you'd like.
 Figure 3. 3-D Atari symbol with X, Y, and
Z axes.
Figure 3. 3-D Atari symbol with X, Y, and
Z axes.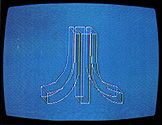
Let's look at the program in detail. It's flexible enough to serve as the basis for your own experimentation.
Lines 50-190 are the plotting subroutine, placed at the beginning of the program to increase speed. Note that line 10 jumps past this subroutine to line 200.
Lines 200-250 dimension strings and arrays and set constants. Line 230 reads ALT$, the name of the object, and LAST, the number of data points in the object. Then it dimensions X, Y, and Z arrays equal to LAST.
This approach allows using the same program for very complex objects with many data points, as long as you don't have so many that you run out of memory. Just be sure that your first data line contains the name of the object and the number of points.
The section from line 300 to 380 reads and manipulates the X,Y,Z data. Line 320 sets all elements of arrays equal to zero. Line 350 reads each set of X,Y,Z values and line 360 puts them in the arrays. The first point becomes X(1),Y(1), Z(1); the second is X(2),Y(2),Z(2), and so on.
Each value is multiplied by a ratio (XRATIO, YRATIO, ZRATIO) to allow changing the proportions of objects without redoing all the DATA statements. This is a handy way to compensate for distortion caused by many TV sets, or to see how an object looks when stretched or squeezed in a certain way.
(To start with, leave all the ratios equal to 1, as set in line 330. If the square looks too wide on your set, make XRATIO less than 1--try O.8. If the square is too thin, make XRATIO greater than 1--try 1.2.)
Since we're using -999 as a flag value, we don't want to multiply -999 by a ratio. Line 370 takes care of that.
Line 390 initializes yaw, pitch, and roll to 0°. Lines 400430 let you select the auto-rotate routine or manual settings.
The auto-rotate routine at lines 600-700 sets yaw, pitch, and roll values to show five different positions for each axis. yOu can experiment with different numbers in the DIRECTION and TURN loops to get more or fewer steps. Changing the values of 75 or 60 degrees in lines 630-650 will alter the amount of rotation between steps.
After the auto-rotate routine is over, line 710 sets MODE = 2 for manual settings. (The MODE variable does not refer to a graphics mode.) Lines 720 to 820 allow entering your choice of yaw, pitch, and roll values, in degrees. Note that you can turn the object on two or all three axes at the same time, if you wish, which the auto-rotate routine doesn't do. Line 830 computes sine and cosine values for yaw, pitch, and roll movements.
Lines 840-860 remind you to press any key when you're done looking at the picture. Line 870 gets rid of the code for the last key pressed (in memory location 764) and goes to the plotting subroutine. Upon returning from the subroutine, line 880 sends you back to enter new data at line 790.
The DATA statements at lines 2000-2050 are sets of X,Y,Z values except for line 2000. This contains the name of the object (read into ALT$) and the number of data points (read into LAST).
Now let's look at the plotting subroutine, lines 50-190. Line 50 sets GRAPHICS 24 (full screen 8 + 16) and sets the background color to black. Line 60 sets FLAG = 0, to indicate that the first point should be a PLOT command. (FLAG=1 means DRAWTO.) It also sets a TRAP 190, to prevent the program from crashing if it tries to plot any points beyond the screen boundaries.
Line 70 begins the drawing loop, working with each set of X,Y,Z coordinates from the array in turn. If Y=999, it's a flag, not a value to be plotted; line 90 takes care of that.
Line 100 begins the math, computing the X,Y,Z position for yaw. Lines 110-120 do the same for pitch and roll. Lines 130 and 140 PLOT or DRAWTO, depending upon FLAG=0 or FLAG= 1. These lines also compute the X,Y equivalents of X,Y,Z by multiplying by the sine and cosine of 45 °, C, or 0.707. HC and VC are the horizontal center and vertical center of the screen, 160 and 90. (This allows setting the object's X,Y,Z coordinates with 0,0,0 at the center, which makes life simpler.)
Line 160 gives a beep to remind us the plotting is complete. If we're in MODE = 2, manual settings, line 170 waits for a key to be pressed before it will move on. Line 180 gets rid of the key code in memory location 764 and returns from the subroutine.
Line 190 is used only if a plotting error calls the TRAP 190 command. Even if your object falls within the screen boundaries when it's not rotated, certain values of yaw, pitch, and roll may move parts of it off the screen. If this happens, generating ERROR 141 or ERROR 3, line 190 sets FLAG = 0, so the next point will be PLOT instead of DRAWTO. (This eliminates drawing an unwanted line from the last legal point on the screen.) Then line 190 resets the TRAP and returns to the next point in the drawing loop. If all the points in your object fall outside the screen boundaries, you end up with a blank screen.
ONCE MORE, WITH EMBELLISHMENTS
Listing 2 is a more ambitious program that draws the Atari symbol in 3-D, or allows you to select views of a barn with silo, instead. It requires a 48K system.
Note that many of the lines from Listing 1 can be reused. In some cases you'll have to change the line numbers.
The program is thoroughly explained with REM statements, so I won't repeat them here. To save typing and make the program run somewhat faster, eliminate all REMs (line numbers ending in 9).
Lines 290-530 enter the Atari symbol X,Y,Z data into arrays. The routine reads DATA statements several times by using RESTORE commands. (This approach saves typing 13 more DATA lines, but requires more program lines. Was the trade-off worth it? I'm not sure.) Note an important difference in these DATA lines, 1000-1110; they contain only X and Y values. The Z values are entered into the array at line 270, where Z =-8 (for the back portions of the symbol). Lines 290-530 change Z to + 8 for the front parts of the symbol.
DATA lines 2000-2160 are for the barn. These lines can be used as is with the short program in Listing 1, if desired. Note that the arrays for the barn data need about 2.7 Kbytes of memory, though; on a small system you may run out of memory.
CREATING YOUR OWN OBJECTS
Using graph paper, imagination, and patience, you can draw three-dimensional objects and enter them into DATA statements so these programs will draw them for you. The barn took about an hour to do, drawing the front, back, left side, right side, and top views.
Remember to center the object at 0,0,0. As much as possible, draw the outline in a continuous line--a series of DRAWTOs rather than using many PLOTs. This is like the puzzle where you try to draw an envelope without lifting the pencil from the paper.
There are a couple of reasons for this. First, using a PLOT and DRAWTO to define a new line means the program has to calculate positions for two points, while extending an existing line with DRAWTO requires only one set of calculations. Secondly, the end of each line requires entering -999,-999,-999, which uses 18 bytes of memory in the array.
Don't worry too much about proportions. If you're off a bit, or if your TV distorts the shape, use the XRATIO, YRATIO, and ZRATIO variables to alter the shape when reading the DATA statements. An XRATIO greater than 1 will make the object wider; less than 1 will squeeze it narrower. Changing the YRATIO makes the shape taller or shorter, and ZRATIO makes it fatter or thinner (along the Z axis). Notice that line 930 of Listing 3 sets XRATIO = 2 because the barn looks too square if XRATIO = 1 . . . at least on my TV set.
If you try these programs and find that three-dimensional drawing really appeals to you, you may want to buy a commercial program. Atari World, in particular, includes utility programs for entering data and uses machine language to draw pictures with impressive speed.