BUSINESS GRAPHICS-
PRESENTATIONS. CHARTS AND GRAPHS
by BRIAN LEE and GORDON WONG
 Nowhere
is the adage "A picture is worth a thousand words" more apt than when you're
doing a business presentation. Bar charts for the boss, pie charts for
the managers and slides for your trainees all fall into the category of
business graphics. Let Brian Lee and Gordon Wong tell you about ST software
that'll give you a good showing at work.
Nowhere
is the adage "A picture is worth a thousand words" more apt than when you're
doing a business presentation. Bar charts for the boss, pie charts for
the managers and slides for your trainees all fall into the category of
business graphics. Let Brian Lee and Gordon Wong tell you about ST software
that'll give you a good showing at work.
Like beauty, business graphics are in the eye of the beholder. Corporate managers today have all the tools of the artist, graphic designer and typesetter at their fingertips in the form of drawing, computer-aided design and desktop publishing programs. For business graphics, though, these tools must take a back seat to charting and presentation software. Charting software generates graphs or charts from the information in spreadsheets or databases, while presentation software automates or replaces the traditional slideshow.
Today, personal computers and business graphic software have made charting easy, fast and accurate. To generate a chart, just enter a few numbers and press a key, and a graph appears on screen or printer. Good charting software supports a wide variety of printers and plotters, and imports numeric information from any spreadsheet or database. It's nice if it includes common database and statistical functions such field searching, sorting, calculating averages, or record counting.
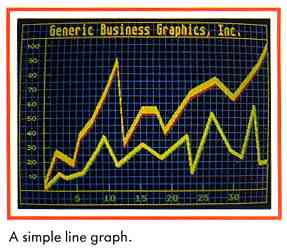
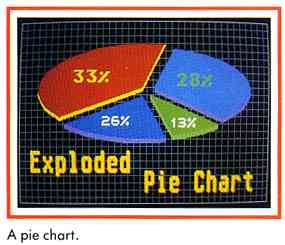
Beyond traditional pie and bar charts, some charting software can render line, scatter, stacked, clustered, high/low (such as those in stock charting), exploded pie, horizontal and vertical graphs, in 2-D and 3-D. And of course, good charting programs allow you to label charts easily.
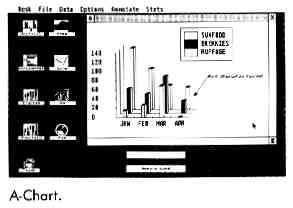
A-Chart
A-Chart can generate area, horizontal and vertical bar, line, 3D bar,
stacked bar and pie charts. The program takes full advantage of the mouse
and GEM to help you create your graph. It's easy to switch to new data,
change the graph type or explode a pie slice.
A-Chart can show up to four different graphs at a time on the screen, and supports up to 20 sets of data per graph (or up to 80 data sets for all the graphs). It can handle up to 30,000 data points on a 520 ST or 100,000 data points on a 1040 ST. You can type in data or import .DIF files from most databases and spreadsheets. You can also save the finished charts as DEGAS-format images, although A-Chart has tools for making graph labels and legends, choosing text font style and size, drawing arrows and creating different line thicknesses and fill patterns. You can place text and arrows anywhere on the screen, and can save and load separately legends, labels, arrows, line and fill patterns.
A-Chart offers statistical functions (including mean, standard deviation, variance, skewness, kurtosis, chi-square and coefficient of correlation), and many mathematical, trigonometric, conditional, logorithmic, and Boolean functions (eg., IF/THEN/ELSE, SIN. ACOS, and LOG).
However, though A-Chart gives you basic statistics, it calculates and displays these values without any graphical representation. A-Chart supports only Epson-compatible printers, but you can use printers supported by DEGAS Elite if you save a graph as a DEGAS image.
A-Chart's user interface, easy data manipulation and internal statistical functions are its strongest suits. Its manual could be improved, with more expansive descriptions of A-Chart's statistical functions and an index. A-Chart runs in medium resolution and is not copy protected.
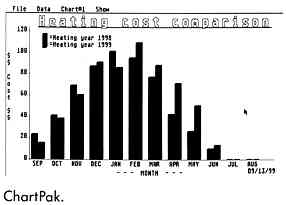
Chartpak
Chartpak is another GEM-based charting program. It offers 11 chart
types: vertical and horizontal line graphs, vertical and horizontal area
graphs, vertical and horizontal 2-D or 3-D bar graphs, X-Y or Y-X line
graphs, or pie charts (with exploded slices). Chartpak can also create
stacked charts for most of these types. Unlike A-Chart, Chartpak's pie
charts are limited to 20 or fewer items.
Chartpak works in any ST resolution, and can show up to four graphs at once It can handle up to ten data sets or a maximum of 1,000 data points in all data sets (each data set has a maximum of 200 points). Since Chartpak's data sets are simple ASCII files, they're easy to generate Chartpak can also import data from Abacus's PowerLedger ST and DataRetrieve programs.
Charrpak can save chart information, such as chart type, labels or title in a separate file, then use up to four of these chart spec files to display a data set in different ways or display different data sets.
Chartpak can also load or save images in .IFF "clip art" format, and use GEM fonts (although not all GEM fonts work with all printers). Lines and fill patterns are preset within the program. Text size, font, style (bold, italic, oudine, etc.) and alignment are adjustable using dialog boxes. Chartpak can also save the whole chart in DEGAS format, and can load DEGAS pictures to use as backgrounds for charts.
Chartpak supports only basic math functions and a few statistical ones such as average and standard deviation. However, the statistical functions are very powerful: Chartpak can compute a least squares regression line and then graphically show the average and standard deviation lines, and use exponential smoothing to compute smoothed and trend values for a data set. The manual supplies extensive examples, usage and explanations on these powerful statistical features.
Chartpak supports a number of printers and plotters, providing detailed information on setting up a plotter command file (although most plotters cannot show clip art, background DEGAS pictures, certain GEM fonts or shadowed pie charts).
One of Chartpak's major limitations is its maximum of 200 data points per data set, especially the 20 data points for its piechart. A small business spreadsheet import would easily surpass those maximums. Chartpak's data entry and chart setup process is time-consuming. The manual tends to delve deeply into details without getting to the point, and its figures need better labeling. And although it details how to read files from Abacus's PowerLedger ST, it doesn't mention DataRetrieve at all.
Overall, Chartpak will meet most business charting demands. Its printer and plotter support is quite extensive, and the advanced statistical functions and ability to alter the aspect ratio of its charts are very attractive, although more trigonometric, logonthmic and Boolean operators, and additional statistical ones such as correlation coefficient or chisquare testing would be nice Chartpak is not copy protected.
Charting in Spreadsheet and Database Programs
Two ST spreadsheets can do charts. If you use one of these spreadsheets,
their graphing capabilities can save you considerable time.
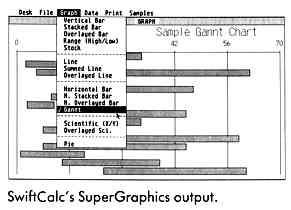
Timeworks' SwiftCalc includes the SuperGraphics charting program. SuperGraphics can generate vertical and horizontal bar graphs in stacked and overlaid formats, line charts, pie charts, scatter plots, and even Gannt or HiLo charts. SuperGraphics can import .DIF format files as well. (Editor's note: For a complete review of SwiftCalc ST and the SuperGraphws program, see "Timeworks' Powerful Business Trio" in the Summer 1987 issue of START.)
VIP Professional and Masterplan from VIP Technologies include rudimentary graphing functions and are best suited to quick overviews of your spreadsheet data, with only limited control over the layout and scaling of your charts. In view of this, if you need greater flexibility or higher quality output, the Time-works SuperGraphics product is a better bet. (Editor's note: Both VIP Professional and Masterplan are reviewed in "Figure it," elsewhere in this issue.)
Presentation Software
Presentation software lets you create video presentations or slide
shows. Good presentations require a variety of free-form drawing tools
such as image crop, zoom, scaling, geometric shape drawing and font text
sizing. Since most managers are not artists, it's useful to have libraries
of art such as business symbols or geographical maps, which you can cut
and paste as you like.
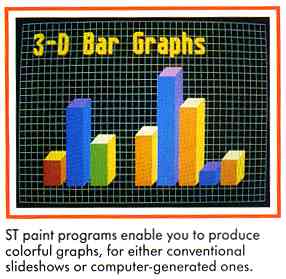
Fortunately, many ST paint programs can accomplish these things. And special animated screen effects such as dissolves, wipes, curtains and splits can help to spruce up the visual impact of the many images in any presentation.
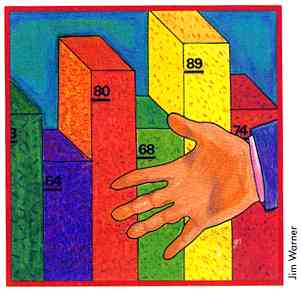
Colorful Charts
For creating images, your best bet are ST paint programs such as NEOchrome
or DEGAS Elite. These can easily spruce up colorful pie and bar charts,
with multiple fonts for labelling images. If your spreadsheet or charting
program can save its charts in a compatible format, it's easy to use these
paint programs. And some paint programs, such as Animator ST and Cyber
Paint, support animation capabilities. That means you can even use animation
sequences in video presentations.
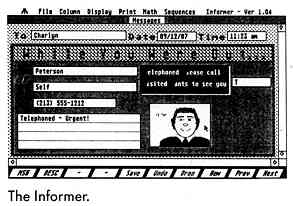
The Informer
One unique presentation package that's not a paint program is The Informer,
a free-form database manager that can import NEOchrome or DEGAS Elite pictures.
You can insert pictures into graphic fields or use them as static background
scenery for database records. For example, a personnel file might include
a digitized picture of the employee as well as the employees name, address
and phone.
The Informer can use full-sized pictures for backgrounds, and either half-or quarter-size pictures in graphic fields. However, retrieving pictures from the disk tends to be slow. The Informer does not have any graphic tools for touching up pictures except adjustable colors. It also lacks cropping tools that would make it much easier to place the quarter and half sizes.
The informer's facility for database processes such as searching and sorting makes it very appealing for some presentations. For example, a real-estate agent could keep a database of new home information-complete with pictures of each home.
Conclusion
All these products will help you create business presentations, but
none is a true presentation graphics program. Such a program would support
a variety of paint formats and have tools solely used to generate and manipulate
images.
For charts, A-Chart is best at creating simple charts that you can enhance with a paint program. For maximum flexibility in preparing graphs (or the more specialized HiLo or Gannt charts), SwiftCalc's SuperGraphics program is your best bet. The basic graphing functions in VIP Professional and Masterplan are excellent for quick viewing of data. And all ST paint and animation programs will liven up your video presentations.
With a well-done chart or graph, a picture isn't worth just a thousand words. To a business, it may be worth a thousand numbers - or a thousand dollars.
If you'd like more articles like this, circle 178 on the Reader Service Card.
Brian Lee is President of Forte Research and Development, a computer software and hardware development company. Gordon Wong is an optometrist and computer enthusiast.
Products Mentioned
- A-Chart, $39.95. Antic Software, 544 Second Str., San Francisco, CA 94107, (415) 957-0886; (800) 234-7001.
-
Animator ST, $79.95. Aegis Development, 2115 Pico Blvd., Santa Monica,
CA 90405, (213) 392-9972.
CIRCLE 179 ON READER SERVICE CARD -
Chartpak, $49.95. Abacus, P.O. Box 7219, Grand Rapids, MI 49510,
(616) 241-5510.
CIRCLE 180 ON READER SERVICE CARD - Cyber Paint, $79.95. Antic Software, 544 Second Street, San Francisco CA 94107, (415) 957-0886; (800) 234-7001.
-
DEGAS Elite, $59.95. Electronic Arts, 1820 Gateway Dr., San Mateo,
CA 94404, (415) 571-7171.
CIRCLE 181 ON READER SERVICE CARD -
The Informer, Version 1.04, $99.95. Regent Software, 7131 Owensmouth,
#45A, Canoga Park, CA 91303, (818) 882-2800.
CIRCLE 182 ON READER SERVICE CARD -
NEOchrome, $29.95. Atari Corp., 1196 Borregas Aye, Sunnyvale, CA
94086, (408) 745-2000.
CIRCLE 183 ON READER SERVICE CARD -
Swiftcalc ST (contains Super-Graphics), $79.95. Timeworks, 444 Lake
Cook Rd., Deerfield, IL 60015, (312) 948-9200.
CIRCLE 184 ON READER SERVICE CARD -
VIP Professional, $149.95; MasterPlan, $89.95. ISD Marketing,
Inc., 2651 John St., Unit 3, Markham, Ontario, Canada L3R 2W5, (416) 479-1880.
CIRCLE 185 ON READER SERVICE CARD