Ray-Trace
Construction Set
Awesome do-it-yourself graphics!
By TOM HUDSON CONTRIBUTING EDITOR
Ray-tracing, the earmark of $25,000 graphic workstations, comes to the ST. Follow Tom Hudson, author of DEGAS Elite and CAD 3-D 20, into a surreal spacetime, where chrome spheres and checkered rooms abound; beams of light are stretched through a 3-dimensional computer world; and the Atari ST is pushed to its enter limits.
One of the most exciting areas in computer graphics today is the use of a technique known as "ray-tracing." This computationally intensive technique, though time-consuming, can produce stunning images, and until recently was only practical on dedicated graphics systems with powerful processors.
Fortunately for us, the Atari ST has the computing power and the graphics features which make ray-tracing possible on a personal computer. The images still rake a while to calculate, but the results are well worth it.
The program TRACER.PRG, in the RAYTRACE.ST folder on your START Disk, will allow you to generate your own impressive ray-traced images with a minimum of work. Its batch control-file allows your computer to create multiple images and save them to disk automatically (for a large number of images, you can actually let your system run overnight completely unattended).
If you have a set of the LC Technologies STEREOTEK glasses, you can even create stereo pairs of a scene for a true 3-D image!
ALL ABOUT RAY-TRACING
To learn about ray-tracing, you must think about how your eyes normally work. Light rays from the sun or another light source illuminate an object and are reflected in many directions. Some of these light rays eventually reach your eyes, impact on the retina, and are relayed to your brain.
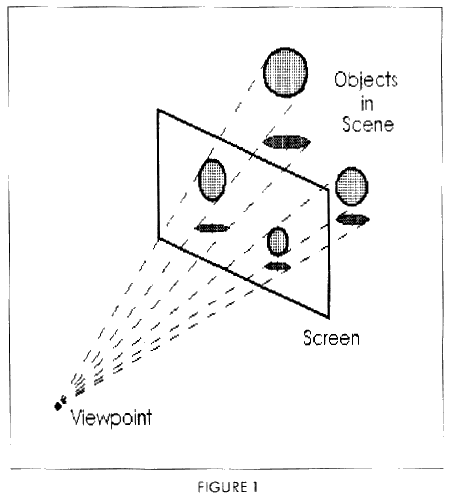
In computerized ray-tracing, it's a little easier. Instead of going from the light source to the objects to the viewpoint, we can start at the viewpoint and "look" out into the scene. In this process, the screen of the computer is an imaginary plane positioned in front of the scene (see Figure 1).
This process is simplified by the fact that a computer screen is made up of square pixels. We simply follow the line (or ray) from the viewpoint through each pixel's location on the screen and out into the scene. When the ray hits something, we can check the color of the object hit by the ray and place that color in the pixel the ray passed through. When this process is repeated for each pixel on the screen, you have a complete image of the scene.
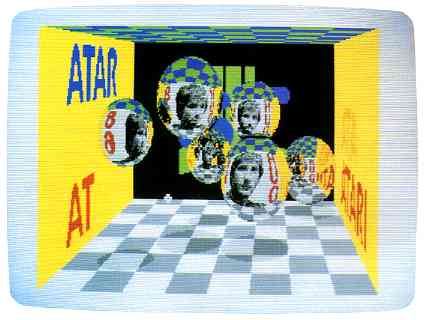
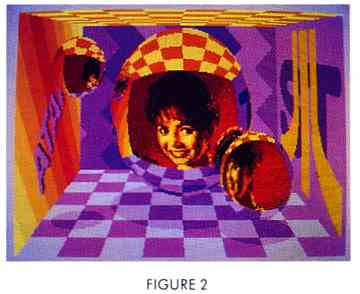
The interesting thing is, you don't have to stop with simple objects. Using the mathematical formulas for the reflection of light, we can make certain objects in the scene reflective. When the ray hits them, we simply calculate the new direction for the ray and continue following it. Figure 2 is a photograph of a ray-traced scene which contains three mirrored spheres of different sizes, created on an ST computer. Note that the walls (images created with the DEGAS Elite paint program and the Computereyes color digitizer) are reflected in the spheres, and the two smaller spheres are actually reflected in the large sphere!
TRACER.PRG allows you to create your own scenes like Figure 2. You can have up to 20 mirrored spheres of different sizes anywhere in the scene, and you define the colors and the images used on the walls of the "room." You also determine the position of the viewpoint so you can create different perspective effects. It will create beautiful three-dimensional ray-traced images in the low-resolution, 16 color graphics mode. It will not run in monochrome mode.
HOW IT WORKS
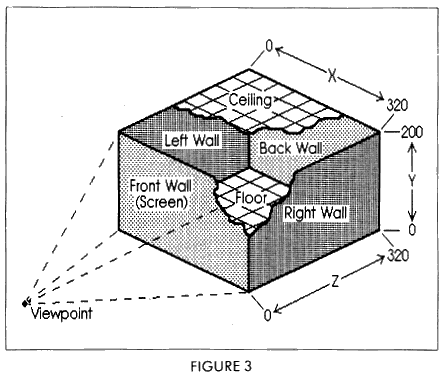
To generate an Image, the program creates an imaginary room in the computer's memory. Each wall of the room is a 320 X 200, 16-color picture taken from a DEGAS picture file. The ceiling and floor are both 320 X 320 checkerboard images which are automatically generated. The room's layout is shown in Figure 3.
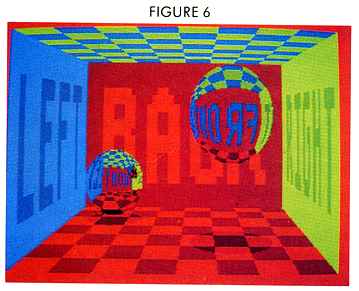
As you can see, the room is a 320 wide by 200 tall by 320 deep area. The left wall is at X coordinate 0; the right wall is at X coordinate 320. The floor is at Y coordinate 0; the ceiling is at Y coordinate 200. The front wall (the wall you're "looking through") is at Z coordinate 0; the back wall is at Z coordinate 320. As you can see by the image in Figure 6, the various walls show up in perspective, and the front wall is visible only by its reflection in the spheres!
will allow you to
create your own
ray-traced images.
The program's operating principle is simple. Four DEGAS-format picture files are loaded into memory. Because all four pictures will be displayed on the screen at one time in the ray-traced image, they must all use the same color palette. This is a tough restriction, but with judicious use of colors you can create very appealing images. The image in Figure 2, for example, began as a Computereyes color digitized photo of a girl (the picture is available on the Computereyes demonstration disk as DEBBIE.PI1). I loaded DEBBIE.PI1 into DEGAS Elite and created a new color palette for the image, placing the reddish skin tones on one end of the palette, and an attractive violet color group on the other end. The DEBBIE image was then "re-mapped" to use the colors I had selected, and saved as the picture for the front wall. The three bitmaps for the other walls were created with the same colors as the DEBBIE picture and saved to disk.
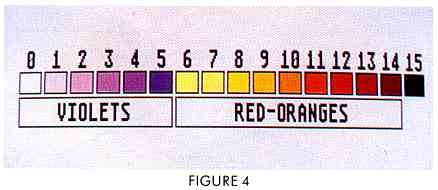
The color palette setup is important. The leftmost four colors on the palette are used to draw the floor of the room, with the first color in the palette being the brightest. Colors 0 and 2 are used to make the checkered pattern, and colors 1 and 3 are used to make shadows (shadows on color 0 are made with color 1; shadows on color 2 are made using color 3). Because of the way the program generates the images, you should have at least six colors in the group making up the floor (see Figure 4 for an example palette).
The best situation you can have when setting the colors for your ray-tracing palette is to have only a couple of colors with a large number of shades of that color. The palette in Figure 4 has only two main colors, but the brightness values range from bright to dim. Having more colors can produce a more colorful image, but may not allow you sufficient shading ability. You'll probably want to find a happy medium between the number of colors and the number of shades of each.
Once the computer knows which images it needs to make the walls, it sets up a user-defined number of spheres in the room. The spheres can be any size, as long as they do not go outside the room's dimensions.
CREATING IMAGES
On the START disk, you'll find a file called EXAMPLE.CTL. This is an example ray-tracing control file. It's a good idea to print the EXAMPLE.CTL file on your printer or load it into a text editor program so you can follow along with the description of the file.
The control file is a simple text file which the TRACER.PRG program uses to describe the "room" being ray-traced and the contents of the room. Any line in the file beginning with a semicolon (;) is treated as a comment and is ignored. This is very convenient because you can add descriptive notes to your control files for later reference. In fact, the example control file already has comments telling the function of the parameter line following the comment.
Lines requiring numeric input are entered very simply Just type the number you want to enter on the line. Don't use any non-numeric characters. Some parameter lines will require more than one value. In this case, just type the numbers, separating them with a single comma. To enter a parameter with the numbers 13, 200 and -30, you would type:
13,200,-30
You can edit the control file with any text editor or a word processor which will edit program text files without doing any text formatting (1ST Word is ideal, just make sure you're not in word processing mode). Be sure to save the file with a CTL extension on the filename. For example: TEST1.CTL.
THE PARAMETERS
The first parameter in the control file is a number that tells the computer how many times to reflect the ray if it keeps bouncing off objects. This value must be at least 1, and I recommend that you set it to no less than 3 for a good effect. The example control file uses a value of 10. The more reflections you allow, the better your scenes will look, because the spheres will reflect other spheres, which are reflecting other spheres, and so on, producing an extremely realistic image. The maximum value allowed is 10. Having a large number of reflections means the image will take somewhat longer to generate because the program must follow the ray for a long distance.
Figure 4 is the color palette used by the wall images in the example control file, which created the image in Figure 2. The colors in the palette are numbered from 0-15. These values are referred to in the next three parameters.
The next parameter is the "infinity color," which is the color register number (0-15) the computer will use if the ray reflects the maximum number of times. I suggest setting this to the darkest color in your color palette. The example control file uses an infinity color of 15, which, as you can see in Figure 4, is black.
The next section of the control file is a table telling the computer the relationships between the colors in the palette. Specifically, it gives the information needed to dim the colors for each successive reflection. Each color register has a parameter line which gives the palette color number used for each reflection. The number of entries on each line must match the number of reflections specified earlier, which in this case is 10.
Looking at the color palette and the dimming table, you can see that the first color in the palette (color 0) uses color numbers 0 (no reflection), 1 (1 reflection), 2 (2 reflections), 3 (three reflections), 4 (four reflections), 5 (five reflections), and 15 (black) for the sixth through ninth reflections, because there is no darker violet shade in the palette. The tenth reflection will use color 15, the "infinity" color specified earlier.
Similarly, the third color in the palette (color number 2) uses color 2 for no reflection, color 3 for one reflection, color 4 [or two reflections, and so on. The tenth reflection is always treated as the infinity color.
As you can see in Figure 4, the palette has two groups of color, a violet group and a red-orange group. Colors 0-5 are violets, colors 6-14 are reds and color 15 is black. The red group (including the black color), 10 color registers, gives us the maximum practical number of reflections the palette can handle. As you can see in the dimming table for color 6, the dimming sequence is 6-7-8-9-10-11-12-13-14-15.
Each color in the palette is given a dimming table because each time the ray reflects off an object, the reflected color is dimmed slightly to simulate the light loss seen in the real world. You must tell the system how all the colors are related so that it can do the dimming automatically. This is simply a process of looking at the color palette used by the wall images and linking the related colors together, starting at the brightest and moving to the darkest.
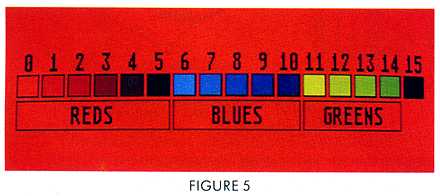
Another possible color palette is shown in Figure 5. This palette has a set of six red colors defined for the floor (0-5) and has two groups of other colors, five blues and four greens, with the last color in the palette set for the infinity color, black. To generate a room with this palette, the parameters would be:
;Ray bounces:
6
;Infinity color:
15
;Palette dimming indexes:
;REDS:
0,1,2,3,4,5
1,2,3,4,5,15
2,3,4,5,15,15
3,4,5,15,15,15
4,5,15,15,15,15
5,15,15,15,15,15
;BLUES:
6,7,8,9,10,15
7,8,9,10,15,15
8,9,10,15,15,15
9,10,15,15,15,15
10,15,15,15,15,15
;GREENS:
11,12,13,14,15,15
12,13,14,15,15,15
13,14,15,15,15,15
14,15,15,15,15,15
15,15,15,15,15,15
In this example color palette and the control file entries, you can see that the colors are grouped into reds, blues and greens. Figure 6 shows an image created with this palette. Using this method, you can build custom color palettes containing several groups of color, in any order.
The next parameter, which also uses the color numbers from the color palette, tells the computer which two colors in the palette to use for the ceiling of the room. The ceiling is a simple checkerboard pattern made of two colors, and is created automatically by the program. In Figure 2, the colors used for the ceiling are number 6 (yellow) and number 9 (red). Since the values given here are color registers, they must range from 0-15.
The next section of the parameter file is repeated for each frame you want to generate. This is the data that determines 1.) how many spheres there are, 2.) where the spheres are located, 3.) what images to use for the walls, and 4.) the filename to save the ray-traced image under. If you want to generate three images, you simply supply this information three times. The EXAMPLE.CTL file is set up to build two frames.
The first frame parameter is the observer's viewpoint. This is a three-number parameter which specifies the X, Y and Z coordinates of the viewer's eye. The X and Y values can be located almost anywhere, but for most images the X value should range from 0 to 319 and the Y value should range from 0-199, so that all the walls can be seen. The Z value must he a negative value. The example control file has a viewpoint X coordinate of 150 (just left of center), a Y coordinate of 170 (slightly below the ceiling) and a Z coordinate of -450. If the Z coordinate is moved toward zero, the perspective effect becomes more dramatic; if moved away from zero, the perspective effect is lessened. Try changing the Z value and you'll see the change in perspective.
The next parameter is the number of spheres in the scene. As you can see in Figure 2, this value is set to 3. You can have as many as 20 spheres in the room (crowded!), or none at all (boring!). For none, enter a zero here.
The program has to know how large each sphere is, so the next parameter tells the radius of each of the spheres. In this case, the spheres are 90, 40 and 30 units in radius, respectively (giving diameters of 180, 80 and 60 units). Because the room is only 200 units high, the maximum radius of a sphere is 99 units (giving a diameter of 198). The program will tell you if a sphere is too large to fit in the room. The smallest recommended size for a sphere is a radius of 30 units, but you can make them as small as you like (down to one unit). If you have spheres smaller than 30 units, the program will run more slowly to ensure that it does not "miss" the smaller spheres. You have been warned!
smaller spheres are
actually reflected in the
larger sphere
The next parameter is a list of the X coordinates of the centers of all the spheres. These values must be such that the sphere remains inside the room's limits. For example, if a sphere is 20 units in diameter, the X coordinate can range from 21-299 (placing the edge of the sphere at 1 or 319, respectively). If a sphere's centerpoint is placed such that the sphere hits one or more walls, the program will tell you about the error Spheres can overlap without incident, though - the program handles it nicely, and the effect can be very impressive!
The next parameter is a list of the spheres' Y coordinates. This is similar to the X coordinate list, but the spheres' Y limits range from 1-199 because the room is only 200 units high.
The next parameter, similar to the X and Y lists, is the list of Z coordinates of the spheres. The Z limits, like the X limits, range from 1-319.
If you're generating a room with no spheres, just enter a single zero for the X, Y and Z coordinate lists.
The spheres in the EXAMPLE.CTL control file range as follows:
Sphere 1: X=70-250, Y=10-190, Z=70-250
Sphere 2: X==200-280, Y=10-90, Z=30-110
Sphere 3: X=10-70, Y=120-180, Z=70-130
The next four parameters are the full file pathnames of the files for the left, right, back and front wall images, respectively. To make a full pathname, you need the drive specifier, the folder names (if any) and the filename plus extension. In the example file, all the images are in a folder called PICTURES on drive E:. The pictures must be stored in uncompressed DEGAS format (you programmers out there can modify the program to load any picture type you like). All four pictures must use the same color palette so they look correct when used together. If you use different palettes in your pictures, the output will use the color palette from the "front wall" picture, and the other walls may appear strange.
The last parameter for the frame is the filename under which to save the ray-traced image when it's complete. The image will be saved in uncompressed DEGAS format. Like the wall image parameters, this parameter must supply the full pathname of the file, including the drive and folder names (if any). If you don't supply the drive, the picture may not go where you want it. In the example file, the ray-traced image will be saved as RAYl.PIl in a folder called GRAPHICS on drive C:. Before running the program, be sure the drive where you'll be saving your images has enough room (approximately 33K per image).
This structure can be repeated as many times as you like to create a large number of frames, each with different sphere numbers, sizes, and even wall images. The EXAMPLE.CTL control file continues on to make a second image, with a different viewpoint, and saves it as RAY2.PI1. The STEELYBOINK! animated demonstration, which I created with the TRACER program, used several different wall images in sequence to create an animated image on each wall. There are 30 frames total in the animation sequence, and to generate all these frames took an ST 25 hours of processing. Fortunately, the automatic nature of the TRACER program allowed much of this processing to take place overnight, completely unattended.
One other convenient feature of the control file structure is that those readers with STEREOTEK glasses can easily create stereo pairs of the room for true 3-D images! Simply create a control file that generates two identical frames, but set different X values in the viewpoint (to simulate the slightly different horizontal positioning of your eyes). For example, a good left-eye viewpoint might be 150,170,-450, and a corresponding right-eye viewpoint would be 180,170,-450. Stereo image pairs can be created in under two hours and viewed with the STSLIDE.PRG program (available on CompuServe's SIG*Atari forum; type GO ATARI16 at any prompt), and the results are simply stunning!
BAILING OUT
Once you start the TRACER program, it asks for the name of the control file with a GEM item selector box. Once you tell it which control file to use, the program reads the parameters and checks for errors. If an error is found, the program displays the line with the error and tells you about the problem. You'll have to re-edit the control file and re-run the program. If there are no errors, the program begins the ray-tracing process.
Before the ray-tracing begins, you'll see the screen clear. Then, if you have spheres in the room, several circles followed by squares will be drawn on the screen. This is the program building the floor of the room with its checkerboard pattern and circular shadows. This is normal. After completion, the screen will clear, ready for the final image.
coordinate is moved toward
zero, the perspective effect
becomes more dramatic.
The ray-traced image will be drawn from left to right on the screen, one pixel at a time. Go and get yourself a snack or peruse other articles in this issue of START because the average frame generation time is approximately 50 minutes. You can watch the progress of the program as the image is created.
If there is a problem (a misplaced sphere or the wrong filename for one of the walls), you can abort the program with the UNDO key. If you have a control file with several different images, pressing HELP will skip to the next image in the control file. If you have built a control file to generate a large number of images and you want to leave the computer unattended to do the job, run the program once using the HELP key to skip each image. Each image's control parameters will be checked and you can catch errors ahead of time. If no errors show up, you can run the program again with confidence that you will not get a parameter error.
After the program has generated the image and saved it to disk, you can load it into a paint program to add text, touch up the image manually or add details. Again, though, the picture is in DEGAS format. If you own another paint program (e.g., NEOchrome), there are a number of conversion utilities available in the public domain, or see Patrick Bass' Grafcon ST The Universal Graphics Converter (Antic, July 1986).
Have fun using the TRACER program. It really shows how the ST's graphics can shine.
DETAILS, DETAILS
If you're a programmer, you'll be glad to know the source files for the TRACER program (TRACER.C and TRACEASM.S) are included on the START disk in the RAYTRACE.ST folder. You can modify the program as you like, to load other types of bit-mapped images for the walls or ray-trace other kinds of objects. The source files are packed with helpful graphics routines.
The code is commented heavily, so I won't go into laborious detail about everything it does.
The first section of the program takes care of reading the control file and parsing out all the information. This section uses several functions to get the job done.
The getparm() function retrieves the next non-comment line from the control file and returns it in the specified string. The ascint() function converts a numeric string into a WORD value. The iaparse() routine parses a string containing numbers separated by commas, placing the parsed values into a programmer-specified WORD array.
The DEGAS-format images are loaded into four 32,000-byte arrays by the loadmap() function. All four images must be placed into memory so the program can get pixels from each as required. To load pictures other than uncompressed DEGAS pictures, just change the code in this function.
Once the walls are loaded, the program creates a special 320x320 bitmap for the floor, containing a checkered pattern and the shadows of the spheres. The scene is lit by an imaginary light source positioned directly above the room. The floor bitmap is made by plotting the sphere shadows (circles) onto the screen in two passes (necessary because the screen handler won't plot beyond the 200-pixel height limit), copying these bitmaps to the floor's buffer (botbuf[], then ORing a checkered bitmap with the circles. Since the shadow circles are plotted in color 1 (VDI index 2) and the checker squares are color 2 (VDI index 3), the floor takes on color 0 (no shadow or square), color 1 (shadow with no square), color 2 (square without shadow) or color 3 (square with shadow). This is what gives the floor the proper shadowing on the squares! Simple, but effective.
create stereo pairs
of the room for true
3-D images!
Actually, in true ray-tracing, we would follow the ray until it hit the floor, then determine whether or not that pixel was in the shadow of an object, but that takes a great deal of extra time. This simple pre-processing makes the operation proceed much faster. Using the existing routines in this program, however, it would not be too difficult to convince the program to do true shadow-checking, where a shadow could fall partially onto the floor and partially onto a wall, bending properly around the corner! I leave this as an exercise to you.
Once the floor bitmap is created, the program begins the ray-tracing process by calling the genframe() function. The primary ray-tracing routine, genframe() calls the trace() function for each pixel on the screen, causing a ray to be shot through that pixel and into the room. The trace() function returns the color of the bitmap (walls, ceiling or floor) that was hit. The boucnt variable holds the number of times the ray bounced off an object, and the genframe() routine then calls myplot() to plot the pixel's color after being dimmed by the number present in boucnt.
The trace() routine is the code that actually takes care of the ray-tracing itself. The movement vector for the ray is calculated from the viewpoint to the screen pixel coordinates, stored in the xi, yi and zi increment variables, and is changed to a step value that moves the ray through the room as quickly as possible without missing the smallest sphere in the room. This step value is set in the bigincs() function.
Once the ray's movement vector is calculated, it is followed around the room until it either hits a wall, the ceiling or floor, or enters the bounding box of a sphere (the bounding box limits of each sphere are stored in the minx, maxx, miny, maxy, minz and maxz arrays).
If the ray hits a wall, the program finds the location where the wall was hit and gets the appropriate pixel from that wall's bitmap, using the get0() function. If the floor is hit, the floor's larger 320x 320 bitmap is used. If the ceiling is hit, a simple calculation determines which ceiling color was hit. The calculation is simply a checkerboard generator.
If the ray has gone inside a sphere's bounding box, the inbox() function is called to do a finer search and see if the ray hits the sphere contained by the box. Testing to see if a ray has hit a sphere takes some time, so this two-stage test for, first, the bounding box and, then, the sphere itself helps speed the tracing process. In addition, the lastobj variable stores the number of the last object hit, so the program doesn't waste time checking to see if the ray which just reflected off a sphere is hitting it again (an impossible case).
The inbox() function first reduces the ray's movement speed (xi, yi, zi) to a low value so that it won't miss the sphere's surface (a larger step value might "skip over" a sphere's edge). It then determines how many bounding boxes it is inside (because the spheres can overlap), and how many spheres it is inside if it is inside one or more bounding boxes.
If it is not in any bounding boxes any more, it can't be hitting a sphere, so the ray's increment values are set back to the large step values with the bigincs() function and the function returns to the main ray-tracer function.
If the ray is inside a bounding box but not inside a sphere, the ray is moved to the next test position and the function loops back to the boxloop: label.
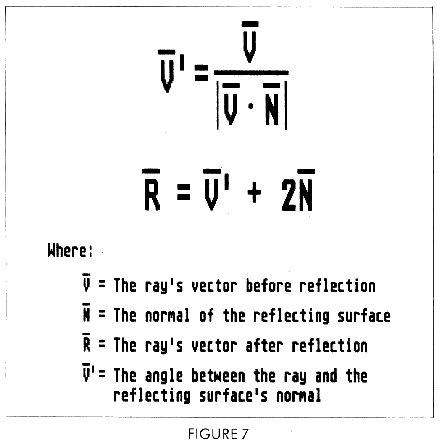
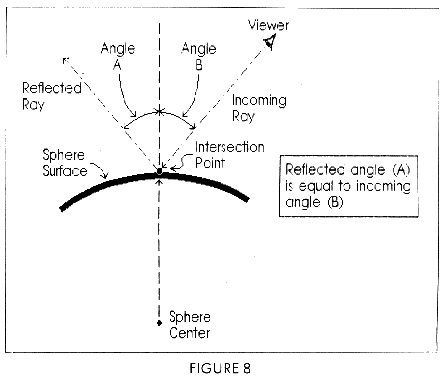
If the ray is inside one or more spheres, the program does a binary search to locate the sphere hit by backing up until the ray is inside only one sphere. It then finds the point of intersection and the ray is bounced off the surface of the sphere according to the formula shown in Figure 7.
This formula is actually a simple application of light physics. When a light ray strikes a reflective surface, it is reflected off the surface at an angle equal to the angle with which it hit the surface but in an opposite direction (my special thanks to Mark Kimball of Tektronix, who explained the formula to me). Figure 8 shows how this works.
The program calculates a surface normal, or direction, for the location on the sphere's surface (the nx, ny and nz variables are the normal's values, calculated from rayx, rayy and rayz, the point where the ray hit the sphere, and xs, ys and zs, the sphere's centerpoint). This direction and the ray's direction are then multiplied into a dot product, which is used to calculate the ray's new direction. The new direction is stored in the xi, yi and zi variables, which determine the ray's movement direction; the program returns to a large increment value, and finally returns to the trace() function.
The inside() function uses a simple test to see if the current ray is inside a particular sphere. To speed calculations, the rsqr[] array holds the radius of each sphere, squared. The distance to the ray from the center of the sphere is then calculated according to the Pythagorean Theorem (minus the square root), and compared to the radius of the sphere, squared. If the calculated value is less than the radius squared, the ray is inside the sphere.
The program uses several custom assembly language routines to plot onto the screen. myplot() plots a pixel onto the screen in any color (this routine is for low-resolution use only). To use myplot(), the pinit() function must be called with the address of the screen passed as a parameter. This builds a lookup table, which speeds up plotting operations.
The get0() function will get a pixel from any bitmap 320 pixels wide (even a larger height bitmap, such as the 320 x320 "floor" bitmap used by this program). The bitmap address and the X and Y coordinates are passed as parameters.
FUTURE EXPANSION
Expanding this ray-tracing program to do more and better types of raytracing would be a challenge for any programmer Some ideas:
* Set up the program to handle both reflective and transparent spheres. Transparent spheres could be handled rather easily because the operation only requires a different formula for calculating what happens to the ray when it hits the sphere. Instead of bouncing off, the ray is refracted, or bent, through the sphere and comes out the other side. For an extremely realistic effect, true refraction modeling will bend part of the ray through the object and part will be reflected normally. Though this is feasible, the 16-color limitation of the ST makes the application of this technique somewhat difficult because such images require subtle changes in pixel luminance not possible with the ST's seven-level luminance setup.
* Allow other types of objects in the scene, such as cubes or free-form 3-D models from programs such as CAD-3D.
* Perform true light-source modeling with shadows. This would take more time, but is perfectly feasible on the ST. With this technique, your image could have realistic shadows (from single or multiple light sources). When the ray hits a wall or the floor, cast a new ray from that point to an imaginary light source. If the ray hits an object before it hits the light source, the point is in shadow.
As you can see, this program could be the starting point for a whole new branch of exciting graphics for the ST. I hope you enjoy working with the program and generating high-quality images. The ST is a truly worthy graphics machine -let's see what we can make it do!
(Editor's Note!: As with the FujiBoink! program in issue #2 of START, we are very interested in seeing what additions our readers can dream up. If you make an interesting mod ification to the Trace program, send it to us at the address in the front of the magazine. We may run it in the magazine and pay you for it, to boot.)
REFERENCE:
BOOKS
Procedural Elements for Computer Graphics ,by David F Rogers, McGraw Hill, pp. 360-381
An Improved Illumination Model for Shaded Display, by Turner Whitted, Communications of the ACM, June 1980, pp. 343-344
SOFTWARE
CAD 3-D 2.0 in the Cyber Studio set
THE CATALOG
544 Second Street
San Francisco, CA 94107
(800) 443-0100 Ext. 133
$89.95
HARDWARE
STEREOTEK Glasses
THE CATALOG
544 Second Street
San Francisco, CA 94107
(800) 443-0100 Ext. 133
$149.95
COMPUTEREYES Color Video Digitizing System
Digital Vison, Inc.
14 Oak Street, suite #2
Needham, MA 02192
(617) 444-9040, 449-7160
$249.95