TUTORIAL
Software Engineering: MORE TOOLS OF THE TRADE
by Karl E. Wiegers
In our last installment, I tried to persuade you that the right way to begin a software development project is to come up with a precise specification of what the system is to accomplish. In other words, we should study the problem before selecting and implementing a solution. Modern software engineering ideas suggest that a good way to approach a new project is through "structured analysis," a process of building graphical models of the desired software system. The ultimate goal is to create a "structured specification" which we hope will be much more understandable and manageable than a monolithic treatise of text.
Illustration by John Berado
Structured analysis: reprise
One of the tools commonly used to construct a system model is a "data flow diagram" or DFD. This is a graphical depiction of the activities carried out by our system (processes), the inputs and outputs of these activities (data flows), organized collections of information (data stores), and objects in the rest of the world which interact with our system in some way (externals). We begin with a very simple, abstract view of our system (the "context diagram"), and decompose that into increasingly more detailed data flow diagrams. This process of "partitioning" or stepwise refinement of our system continues until we've subdivided each high-level process into its individual components. Of course, the definition of an "individual component" is up to you.
Keep in mind that the tools and ideas of structured systems analysis are also used in structured systems design. The two processes are very similar in methodology. During analysis, we are defining all the functions and components of the system we want to build. During design, we are actually defining the individual program modules that will go into our computer program, along with the details of the data connections among them. Most of what we say about analysis tools will also apply to design, which we'll discuss in more detail in the near future.
The idea is to base the design upon the partitioning revealed by structured analysis. While the top-down decomposition will be essentially the same for both analysis and design, the details of each individual component will evolve from conceptual (analysis) to practical (design).
Also, remember that we're discussing methodologies for creating software systems more effectively than we might be able to using older, less structured methods. These "rules" shouldn't be obeyed blindly in every case but should be adapted to situations that are unusual. In fact, there are several schools of thought and sets of conventions for using each of the structured analysis/design tools I'm presenting to you. I'm not preaching dogma here, just trying to share some techniques that many professionals have found to be valuable.
More on data flow diagrams
Last time we looked at the context diagram and zero-level DFD for a real program, a chemistry game I wrote called Reaction Time. We covered some of the basic rules of drawing DFDs. A fragment of the zero-level diagram is repeated in Figure 1, showing just Process 4, "Evaluate Equation," and the data flows and stores that connect it with rest of the system. Now you can see why we put data stores between each pair of processes that are connected by a flow of data. By cutting one process out of the diagram along with its connected data flows and stores, we can examine just that one process more carefully, without being distracted by the rest of the diagram.
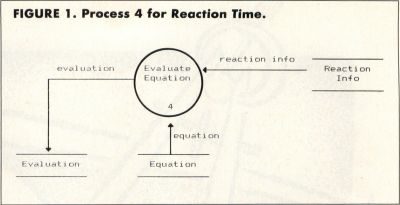
This is one of the real advantages of using DFDs to decompose a system into small components: We can focus on just one part of the system at a time. While this approach is very useful during analysis, when we're trying to get a handle on the individual functions of our system, it's at least as important during the structured design phase. During design, we're actually defining the individual program modules that will make up our final software system. The modules will be represented by processes on the DFDs, and the data interfaces between modules are represented with the data stores. We'll talk more about this in a future article.
It's very important to give the components of your DFDs meaningful names. Notice from last time that I used names for the processes like "Evaluate Equation," "Change Scores," and " Load Reaction Data." Processes should be given names with a single verb and a single object, not unlike the commands you might supply to a simple computer adventure game. If you find yourself using process names with two verbs, such as "Build and Evaluate Equation," you haven't finished your partitioning task; this process should be split into at least two separate ones.
These may seem like trivial details to worry about. How important can the names of data flows and stores really be? Darned important, if you want to make sure you really understand the structure and function of your system. Vague names like "inputs" for a data flow and "Handle Inputs" for a process aren't meaningful enough to be understood by a non-expert looking at your diagrams. And a vital goal of structured systems analysis is communication. When you've finished this step, your product ("deliverable," in the jargon) includes detailed documentation of all the features and functions of the system. In principle, this collection of words and pictures can be handed to any skilled software engineer to be turned into a computer program.
It's also important to make sure that your DFDs are in fact correct. We now need some other Important Rules to keep in mind as we ponder this point (the first four rules were presented in our last article, on system specification and analysis).
Important Rule #5 for DFDs: All data stores should have data flowing out of them. There's no point in placing data into a store if you don't plan to use it again somewhere in the system. Of course, the process that reads data from the store could be on a different diagram from the one that writes to the store. After all, it is through data stores that processes communicate with one another.
Important Rule #6 for DFDs: All data flows should begin and end at data stores, processes, or terminators. You don't want any flows falling off into midair or appearing out of nowhere, because that just introduces an ambiguity (at best) or an error (at worst) into your depiction of the system.
Naturally, following all the rules for drawing DFDs doesn't guarantee that your system is analyzed correctly or that the diagrams make any sense. It just means you followed all the rules, a necessary but not sufficient condition for drawing a useful data flow diagram. Keep the Important Rules in mind at all times!
DFD leveling
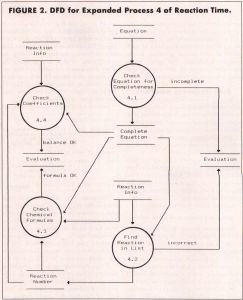
As an example of further decomposition, Figure 2 expands the process called "Evaluate Equation" into four daughter (or, if you prefer gender-neutral words, child) processes. These are numbered 4.1, 4.2, 4.3 and 4.4. Children DFDs of process 4.1 would be numbered 4.1.1 4.1.2, and so on. Using such a numbering scheme, you can break any process down into as many levels of detail as you need. In fact, the partitioning process is sometimes called "leveling," and the result is a set of "leveled data flow diagrams." I simplified Figure 2 by leaving some data flows unlabeled; recall our convention that unlabeled data flows take the name of the data store to which they are connected.
Also, I invented a couple of new data stores, "Complete Equation" and "Reaction Number," to represent the communication of information between processes on this diagram level. The stores called "Evaluation" and "Reaction Info" appear in two places, just for convenience of drawing and to avoid having flow lines cross each other. Remember that these data stores are just logical items or collections of data, not necessarily corresponding to physical files.
Important Rule #7 for DFDs: The net inputs and outputs of each child diagram must match those of the parent diagram. All you're really changing when you draw a child diagram is the process, which is now being represented in more detail as several individual processes. Of course, you can create new data stores that are local to the child DFD (or children of that DFD), but the net inputs and outputs must be the same for parent and child. Another way of saying this is that parent and child DFDs must be "balanced" properly.
Notice that, whereas Figure 1 showed the input into the data store called "Evaluation" to be simply a data flow named "evaluation," Figure 2 shows that several different kinds of information can wind up in the Evaluation store. Exactly what sort of data ends up in Evaluation depends on the output from the various processes having flows going into Evaluation. In Reaction Time terms, the player's chemical equation can be judged to be incomplete or incorrect, and the flows "balance OK" and "formula OK" both can take on values of either "yes" or "no."
Hmmm. Now we have another problem. We've been drawing more and more diagrams, introducing ever more processes, flows, and stores (but not externals; they all appeared on the context diagram). We are developing a fairly substantial vocabulary of objects in our system. How can we keep them all straight? How can we indicate the individual data elements that make up a composite flow or store? The answer is to use another tool of structured analysis (and design), the data dictionary.
The Data Dictionary
I had a nightmare once. I dreamed I was working on a large software project with two other programmers, using four different computer languages. However, we never told each other what variable names we were using for each item of data in each language, or the exact characteristics of each data item. In this dream, we used four different variable names to represent the user's name in the FORTRAN programs alone! I woke up in a cold sweat at the horror of this situation.
Unfortunately, I was sitting at my desk when I woke up, and the nightmare was the real thing. What was the fundamental problem? Communication. How could we have solved it? With a data dictionary.
A data dictionary is essentially a collection of data about data. (I learned that from the Department of Redundancy Department.) Actually, this makes sense. We need to collect information about the individual pieces of our analysis (or design) into a central repository, so anyone interested in the system can look up the details about every piece it. And isn't this just what a dictionary is?
Our data dictionary for Reaction Time isn't too elaborate. We need definitions of each process and external. The data flows and stores themselves will have to be defined, both as to individual data elements as well as how collections of these elements are arranged in each logical data store. Many large systems end up with a gigantic data dictionary. In fact, some companies maintain a corporate data dictionary, so that all the system developers and programmers working in the company agree on the characteristics of each piece of information pertinent to the company's business. This greatly facilitates the creation of new systems that must interface to existing systems.
Data Dictionary notations
To make the data dictionary more readable, some notations have been invented to represent common situations that arise when describing pieces of information. These notations help avoid using phrases in the dictionary entries that just add volume to the text without contributing new information content.
Here's an example. One of the data stores on the zero-level diagram for Reaction Time was called "Reaction Files." One way to write a data dictionary entry for Reaction Files might be: Reaction Files consists of seven sets of reaction info.
A much more concise definition is:
Reaction Files = 7(reaction info)
We've done several things in this simple definition. First, we depicted the definition as an equation, where the equal sign means "consists of" or "is composed of" or "is equivalent to." That simple substitution of one symbol for several words shortens the entry considerably and (I think) makes it much easier to read.
Second, we introduced a new notation, using the curly braces to represent the idea that one piece of data is made up of several repetitions of a smaller piece of data. Using this notation further shortened the definition by removing several more words. This technique continues our philosophy of stepwise refinement or top-down partitioning, by breaking one object down into its component parts. Did you notice that the second definition is much more visually comprehensible than the first? Remember, our emphasis is on effective, efficient communication; all of our software engineering tools are geared toward that goal.
The curly braces can be used to represent several sorts of repetition. Simply enclosing a data item in the curly braces means that an indefinite or arbitrary number of occurrences may be present. The example above indicates that seven (and only seven) repetitions of reaction info make up the Reaction Files store. A notation like:
Reaction Files = 3(reaction info)10
would mean that Reaction Files is made up of between three and ten (inclusive) reaction infos. So what's a "reaction info"? Figure 3 shows more of our Reaction Time data dictionary, further illustrating the partitioning of data and showing the other data dictionary notations that are commonly used. Below I'll write out these definitions in words; see if you like the forms in Figure 3 better than the ones that are pure verbiage.
Reaction info is made up of 16 chemical
Reaction Files = 7(reaction info}
reaction info = 16 {chemical formulas}
              + number of reactions
              + number of sets
              + 9{reaction data)16
number of sets = [2|4]
reaction data = reaction number
              + 4 {compound number}
              + 4 {coefficients}
              + (symmetry factor)
coefficients = [l|2|3|4|6]
                            FIGURE 3
|
formulas, plus the number of reactions in the set, plus the number of sets, plus from nine to 16 sets of reaction data. The number of sets can be either two or four. Each set of reaction data consists of a reaction number, plus four compound numbers, plus four coefficients, and an optional symmetry factor. The values of the coefficients can be 1, 2, 3, 4 or 6.
Notice that neither in the preceding paragraph nor in Figure 3 have we actually given descriptions of any of these pieces of information. That's the final part of the data dictionary, and an extremely important part it is. However, I don't need to burden you with detailed descriptions at this point; I think you get the idea.
What we've really done in Figure 3 is describe the "data structures" in our system in a hierarchical fashion. If we continue this decomposition far enough, each item on the right of an equal sign in a definition ultimately will be a fundamental "data element," which must have its own description in the dictionary. Note that every single data store and dataflow in your system should be included in your dictionary. At this point in the analysis, we don't need to worry about the detailed characteristics (integer, 5-byte character string, etc) of each piece of data. That sort of implementation detail can wait until the design phase.
Please look again at Figure 3. We already discussed the use of curly braces to depict repetition (sometimes called "iteration"). The data structure for "reaction info" also shows the use of the plus sign to indicate concatenation of two or more components in sequence. Items like "number of reactions," which aren't broken down further in the dictionary, are data elements.
The definition of "number of sets" doesn't show any further decomposition, but it shows yet another operator. The square brackets indicate that the item being defined can take on one of the values inside the brackets that are separated by vertical bars. This vertical bar represents a logical OR operator in many computer systems. In other words, "number of sets" can have one of only two possible values, 2 or 4. Similarly, "coefficients" can take on one of five possible values, as shown in the final entry in Figure 3.
Finally, the definition of "reaction data" shows the inclusion of an optional data element, "symmetry factor," which is enclosed in parentheses. This indicates that one "reaction data" item might contain a symmetry factor, while another may not.
That's it, folks. Only those five notations are necessary for showing a whole spectrum of data dictionary entries. And they can be combined in virtually any way. You could have curly braces around an item that contains a bunch of separate items combined with plus signs. You can have curly braces nested within curly braces. And so on.
Here's how you might use the data dictionary for some project whose details weren't all contained in your brain at the moment. Suppose you looked at Figure 2 and saw the data flow labeled "incomplete" going into data store Evaluation. This tells you immediately that there could be other things in Evaluation besides "incomplete," or else the flow would have the same name as the store You turn to the data dictionary and find an entry for Evaluation that looks like this:
Evaluation = [incomplete | incorrect |
              balance OK | formula OK]
NOTE: Insert appears as one line on your screen.
Now you know that "incomplete" is one of the four possible values that Evaluation could contain. Voila; the mystery of the relationship of flow "incomplete" to store Evaluation is revealed.
Realistically speaking, you aren't likely to write up a data dictionary like this for every small project you do. But a data dictionary can be a life-saver if you're working on a large project over a long period of time, or with other programmers, or on several projects with a common focus or data foundation. Plus, it makes great documentation if you have to refer to an old project, of any size, in the far distant future.
How about data dictionary entries for processes? After all, they're certainly objects in our system diagrams. While you should include at least a brief description of each process in your dictionary, the detailed internal structure of a process is defined using yet another modeling tool, called the "process narrative," among other names. We'll look at these more closely in our next installment.
Getting started with DFDs
By now you may well be overwhelmed by the idea of starting your next programming project by drawing a million data flow diagrams and writing a billion data dictionary entries. I've found that a good way to become familiar with these modeling ideas is to apply them to the last program you wrote, before using them for real on the next system. This way you get some practice drawing the diagrams for a system that has already undergone the partitioning process (I hope!) in your head, and at the same time you create some pretty thorough documentation for that older system.
While I have the utmost confidence that you've already documented all your earlier work (right?), some additional pictures can't hurt. And after drawing the appropriate diagrams through this process of "reverse engineering," you should have a better feel of how to use DFDs to depict the essential characteristics of any software system, new or old.
Final words on structured analysis
This pretty much wraps up our introduction to structured analysis, a very important step in modern software development. Remember that the product of analysis is a structured specification, including data flow diagrams and a data dictionary. This specification is really a model (or models, depending on the nature of the project) of the software system you intend to construct. We use a process of stepwise decomposition to identify the essential functions of the system and the movement of data among the system components. This "divide and comprehend" approach makes it much easier to understand a system of any size, as well as facilitating communication with anyone else involved with the project.
Of course, you don't want to fall into the trap of analysis paralysis, in which you spend all of your time fine-tuning your specification models and never get around to actually building the system. However, pinning down the system requirements helps immeasurably when you get to the point of trying to implement the thing. And it's a lot easier, faster, and cheaper (in terms of your time) to correct errors in the model than it is to change the program code.
From analysis to design
The next step in our software development life cycle is design. If we already have the models from structured analysis, there's no need to redraw them all, because the partitioning is (presumably) okay. You might redo some of the lower-level DFDs to make the processes correspond more closely to specific program modules, as we'll discuss in the near future. Also, the process narratives would be rewritten to be much more implementation oriented.
You might not be dealing with a system so large that a complete structured analysis is required. A small project might be able to get by with an itemized list of the specifications of what the system is intended to do. In that case, you would draw data flow diagrams during the structured design phase. This is very similar to structured analysis at the more abstract levels, but the diagrams take on a physical implementation flavor at the more detailed levels.
In any case, you certainly should draw DFDs before you sit down with a source code editor and start spewing out program statements. The fundamental idea of software engineering is to add a degree of rigor to the process you currently use to develop your software projects. Next time we'll take a look at different ways to describe the internals of processes, and we'll begin to discuss some other aspects of sound, high-quality program design.