IBM Pie Chart Maker
Michael Posner
This useful program takes the raw figures you enter (up to nine items) and automatically translates them into percentages to create perfectly proportioned pie charts, in color. It requires an Enhanced Model PCjr with Cartridge BASIC or a PC with a disk drive, BASICA, and the color /graphics adapter.
"IBM Pie Chart Maker" uses the medium-resolution graphics screen (SCREEN 1) to create easily understood pie charts. You need no programming ability to use Pie Chart Maker, and a help screen is always available.
If you want to generate a hard copy printout of a chart, be sure to load the DOS screen-dump utility after booting your system disk (type GRAPHICS at the DOS prompt with the DOS disk in the drive, before loading BASIC). Then, to make a screen dump, switch on the graphics printer and press SHIFT-PrtSc (press Fn-P on the PCjr).
Menu Options
When you run Pie Chart Maker, an option menu appears on the screen:
1 Create a pie chart
2 Save current chart
3 Load chart
4 Alter current chart
5 Clear current data
6 Print chart on screen
7 Help
8 Exit Pie Chart Maker
To perform one of the functions, press the corresponding number key.
Option 1 is described in detail in the next section.
Option 2, "Save current chart," asks you to specify a filename for the chart. When the file is saved, control returns to the menu.
Option 3, "Load chart," prompts for the filename of the chart you wish to load. After it is loaded, the menu reappears. Please note that loading a chart erases any chart in memory.
Option 4, "Alter current chart," lets you change data in a chart. Pie Chart Maker lists the current values and asks for the number to be changed. Enter this number, then the new value(s). These are substituted, and again the program asks for the number to be changed. Entering a zero returns you to the menu.
Option 5, "Clear current chart," erases the chart in memory. As a precaution, the program asks for verification before executing this command.
Option 6 prints the chart on the screen. As mentioned above, use the PrtSc key to reproduce the chart on the printer.
Option 7 calls up the help and instructions screen. Press the space bar to return to the menu.
Option 8 exits Pie Chart Maker and returns to BASIC. Again, the program asks for verification.
Creating A Pie Chart
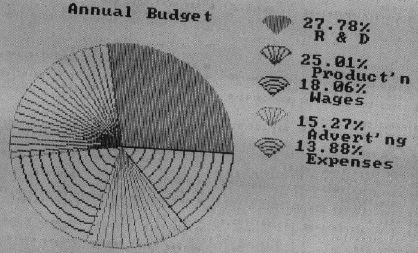
Creating a pie chart is easy. Let's say you wish to chart the annual budget of a small computer company with the money distributed as follows:
| Purpose | Amount |
| 1. Research and Development | $20,000 |
| 2. Production | $18,000 |
| 3. Employee wages | $13,000 |
| 4. Advertising | $11,000 |
| 5. Other expenses | $10,000 |
The first prompt after selecting Option 1 on the menu is "Name of chart?" An appropriate entry would be "Annual Budget." For "Number of items?" you would enter the number 5. Pie Chart Maker accepts up to nine data items. For "Number 1?", enter 20,000, and for "Name 1?", enter R & D. Note that names longer than ten characters are shortened to ten in the print on screen mode. Enter the other four data items for the budget accordingly.
The next prompt asks, "Are you using a color monitor (0 = color, 1 = no color)?" Enter the appropriate answer. Then Pie Chart Maker exits to the menu.
|
Program breakdown: 20–90: Set variables and error trap, go to menu. 100–250: Create chart. 260–270: See if chart is defined. 280–300: Clear variables, draw main circle and initial ray. 310: Set up main loop, choose color. 320–350: Find point for line, draw line. 370–420: Fill with PAINT. 440–500: Fill with LINEs from center. 510–570: Fill with arcs. 590–630: Draw circle portions for key. 640–880: Choose filler and fill circle portions. 890–950: Print percentages, name of chart, return to menu. 960–1100: Print potions, go to selected option. 1110–1150: Error trapping. 1160–1260: Save chart. 1270–1340: Load chart. 1350–1430: Help and instructions screen. 1440–1580: Alter data. 1590–1620: Clear chart data. 1630–1660: Exit to BASIC. 1670–1810: Find percentages. Variables: XC x coordinate of main circle. MR radius of main circle. XK x coordinate of circle portions of key. PX x coordinate for placing percentage. XL x coordinate for placing data name. CL,SL point on circle to which ray is drawn. NG$ name of graph. CV color : 0 = yes, l = no. N number of items XL(N) datum number n. X(N) Percentage for datum number n. N$(N) name for datum number n. YP(N) Coordinate for n$(n) (percent printed at YP - 1). |
Programming Notes
Pie Chart Maker first computes the percentage of each figure you enter. Then it draws the main circle. It converts percentages to degrees, and then to radians. The BASIC trigonometry functions sine (sin) and cosine (cos) are used to segment the main circle according to the percentages computed for the various data items. As each portion is drawn, it is filled in one of three ways. The PAINT statement of BASIC is the first Choice. A second choice is a series of rays from the center of the circle to the edge. Third is arcs of decreasing radii. All these may be done in three colors.
Next, the program prints the key at the right of the screen. The circle portions are plotted using a circle command within a FOR-NEXT loop, and then are filled in the same way as the portions of the main circle they represent. Finally, the program prints the percentages and labels.