INVEST
Gregory R. Glau
P.O. Box 1627
Prescott, AZ 86302
Editor's Note: Program 1 is the Microsoft version. Program 2 contains the lines which should be changed to permit "INVEST" to run on the Atari. Lines 12000-14999 are the printer routine and might need slight modifications for different printers. For the Atari, change all PRINTs to LPRINT and remove the TAB statements.—RTM
Other than having a place to live, there's only one reason to buy real estate: to make money.
INVEST will give you a head start if you're considering this unique investment medium. It'll show you how real estate leverage, inflation, and rent income will all add up to put real cash into your pocket: if you make the right investment decisions.
And once you find some properties to consider, INVEST will detail the benefits to you, to aid you in making that right decision.
You may have heard lots of stories about real estate—many are true!—about how you can buy property for little or no cash down, and then let your wonderful tenants pay for the property for you! About how the government allows a real tax break for real estate investors (called depreciation) which will put cold cash into your pocket come tax time. And, these days, depreciation works a double advantage for us because, while we're allowed to depreciate the property on our tax returns, the building is actually increasing in value every day — often as much as 15 or 20% in a year's time.
Stocks and bonds and gold and jewelry simply can't match this.
There are four areas which give you a return on your realty investment: cash flow, equity buildup, asset appreciation, and tax savings.
The whole purpose of INVEST is to let you figure, by changing the data, exactly what an investment will do for you and detail that information for all four factors (cash flow, appreciation, etc.). Then it's your job to find some properties and use INVEST to help you determine which is the best for you!
Learning The Vocabulary
Cash flow is simply what's left after you collect your rents and then make the payments, pay any expenses, etc. For instance, if your rents (for, say, a duplex you want to buy) are $500 per month, you'll have a total income of $6000 per year ($500 per month x 12 months).
If your monthly payments and expenses total $400 per month, you'll have a yearly cost of $4800 ($400 per month x 12 months). This will give you a positive cash flow of $ 1200 per year ($6000 collected less the $4800 spent).
Sometimes, particularly with an investment which has a low down payment, you could have a negative cash flow. For instance, if your payments plus expenses ran $7000 per year, you'd be $1000 in the hole at the end of the year ($6000 collected less $7000 spent equals a minus $1000). This isn't always bad, as we'll see in a moment.
Equity buildup is the second area where you get a return on your investment. As you make the payments on the property, part of the payment goes for interest, and part for principal. At the start, this interest section eats up most of the payment and, as time passes, the part devoted to principal gets larger and larger.
Note that this is not cash which you'll get as you do when you collect the rents. It's like a savings account — you'll get this part of your investment when you sell the property, because each part of your payment that goes against the principal reduces what you owe on the property.
For instance, if you bought a $100,000 fourplex with $10,000 down, you'd have to borrow $90,000. If you sold it to me tomorrow for, say, $120,000, you'd come out of the deal with a $20,000 profit, right?
However, say you held it for a year and then sold it for the same price. At the end of the year, your payments would have reduced the amount you owed on the property — the actual reduction would depend on the interest rate and length of the loan. But let's say that it, the principal, had been reduced $5,000 over the course of that year. Now, you'd end up with $25,000 (instead of the $20,000 above) — while the extra $5,000 is not profit, it does come back to you, just as if you'd put it into a savings account.
| 1st example: | ||
| Selling price | $120,000 | |
| still owe | –90,000 | |
| down payment | –10,000 | |
| cash | 20,000 | (all profit) |
2nd example (hold the property for a year):
| selling price | $120,000 | |
| still owe | –85,000 | remember—our payments have reduced the principal from $90,000 down to $85,000 |
| down payment | –10,000 | |
| cash | $ 25,000 |
Of this, $20,000 is your profit and $5,000 represents a return to you of your equity just as if you'd saved this money in a bank. And each payment you make (actually it's those wonderful tenants who make the payments for you, right?) increases the equity, your ownership, in the property.
The third way you get a return on your investment is through asset appreciation. This is the amount a building increases in value because of rising prices, inflation. In many cases in recent years, income property has gone up in value faster than the rate of inflation.
And, as you may already know, there are two types of inflation: normal inflation and forced inflation. But even if normal inflation slows down—and don't bet that it will—you can use forced inflation …fixing up a property to make it rent for more, thus making it worth more.
Perhaps you could buy a property for, say, $65,000 and with some paint and carpeting and cleaning increase its value to $75,000. And, of course, you can always combine the two types of inflation, and really increase the return on your investment.
Finally, tax savings is the fourth method of return on a real estate investment. Tax savings stems from depreciation, the concept that everything wears out and thus, at some time in the future, it will have to be replaced. The Congress of the US has recognized this fact, particularly in regard to investment real estate, and allows the owner of such property to depreciate a part of the building and of its contents each year (just as if he took X amount of cash and put it into a bank) to help pay for the replacement cost of the building or contents.
Depreciation is based on what accountants call "useful" life, and varies on a building with its age, condition, etc. An old building might have a "useful life" of only 10 or 12 years, while a new structure might be expected to last 30 years.
The actual length for depreciation for any particular property must be determined by your accountant.
Obviously, the shorter the "useful life," the more depreciation you can take per year, and the more the tax savings will be.
For instance, let's picture that you bought (or want to buy) a triplex which will cost you $100,000. First, we have to deduct the value of the land—land cannot be depreciated, it doesn't wear out. Let's say that you figure, from tax records and property comparisons, that the land value is about 15% of the total purchase price. This means the land cost was $15,000 (15% of $100,000). Deducting this from the purchase price of $ 100,000, you now have $85,000 left.
Now, the carpeting drapes, appliances, and so on will wear out faster than the building, so you're allowed a faster rate of depreciation on these items. Again, ask your accountant. In INVEST, we figure that about half the value of the furnishings are in items that have a three year "useful life" for depreciation, and then about half the value is in items that would have a seven year "useful life," so we've taken them and lumped them together, and figured an average of a five year useful life.
In this example, if you have furnishings worth 5% of the value of the property, you'd have furnishings worth $5,000 (5% of $100,000).
So, you deduct the value of the furnishings ($5,000) from the net property value (after the land has been removed) of $85,000, which gives you a net building value of $80,000.
Let's further assume that your accountant tells you that this building has a "useful life" of 20 years.
Now, to figure the depreciation: you have an $80,000 building, with a life of 20 years…you simply divide the value by the years, to get a per-year amount for depreciation. $80,000 divided by 20 years equals $4,000 per year. This is the amount of depreciation per year allowed on this building.
INVEST takes things a step farther, by asking you how many months this year you'll own this property. It will then give you two displays and printouts—one for this year, the number of months you'll own the property, and then for next year, which is figured at a full twelve months. Obviously, if you're buying the building in June, you wouldn't own it for a full year, so INVEST automatically will calculate the exact depreciation (and tax savings) for the part of the year you'll actually own the property.
Added to the building depreciation is the depreciation you're allowed on its contents. Remember that we had $5,000 worth of carpeting, drapes, appliances, and so on. We're using an "average useful life" of five years, so we divide the amount of $5,000 by five years, for an allowable depreciation of $1,000 per year on the building's contents.
Total depreciation, then, is the building depreciation of $4,000 per year plus the contents depreciation of $1,000 … for a total of $5,000 per year.
The Tax Savings
This is the amount you can deduct from your income tax. To figure your tax savings (how much less you'll have to pay in taxes, or how much cash they'll send back to you), multiply your tax bracket by the amount of depreciation.
For example, if you're in the 30% tax bracket, you'd save 30% of $5,000 depreciation, or $1,500 on your taxes.
It's important to note that these savings—tax savings —return to you in the form of cash, either in a tax refund or because you will pay less in taxes than you would have had to without them, as compared to equity buildup and asset appreciation, which return to your wallet only when you sell the property.
In fact, the tax savings are often enough to offset any negative cash flow you might have from a property. So, while you might have $100 a month in negative cash flow, perhaps at the end of the year you'll get back that cash, just as if you'd saved it in a bank every month!
INVEST will show you exactly what your results will be.
So, these are the four vital areas we need to consider for any real estate investment: cash flow, equity buildup, asset appreciation, and tax savings.
"INVEST" will not only show you what each item will do, based on your own data, but will also summarize and total them, compare them to your down payment, and provide you with a return on your investment percentage.
And this, your return on investment, is really the important figure for any investment program. All the various parts of any investment, such as the real estate we've been examining here, are combined in this figure.
It's fascinating to see this in action, because many of us think in terms of savings accounts (perhaps 5 or 6% on our money)… or certificates of deposit (perhaps 14%)… or stocks (what will the market do tomorrow?)… or limited edition prints (nice to hang on the wall, but who can we sell it to?)… or money market accounts (10 or 12%)… and when you see what real estate can do for you—even a small duplex or triplex—you will be astonished.
Using INVEST
Once you get a printout of a specific set of data, the program will automatically end. Up to that point—before you ask for a printout—you can alter any data any number of times, to display different results. Then, when you have the display you want, you can request a hard copy.
There's a delay at the end of page two of the instructions: while you're reading them, your computer is reading array information into its RAM. We're using three double-dimension arrays:
Q is the information used to get your monthly payment. The program will multiply the amount of your loan(s) by the proper monthly figure, to arrive at a monthly payment. You can input up to 3 loans, for 15, 20 or 25 years, and at interest rates from 10% to 18%, in .5% steps. Then "INVEST" will total the payment, display it, and let you change the amount, if you wish to. This situation might occur if you happen to be assuming an old loan, at less than 10%—you can answer 10%, and then change the payment total to match your correct figure.
E1… is the array with the figures for the first-year equity buildup.
E2… is the array for the second-year equity buildup.
Two arrays are used here because the equity buildup is different for each year—you will pay more on the principal of your loan during the second year than you did the first. The actual multipliers are based on the length and terms of your loan—a loan at 10% for 15 years will have a much faster and higher equity buildup than one at 16% for 25 years.
Total rents are just that—if the property you're considering is a fourplex, input total rents from all units.
If you don't know the actual amount of taxes and insurance, or expenses, use your best estimate.
Your accountant will know your approximate tax bracket, or you can check the tables on Form 1040, or look back at your latest tax return.
When you're asked to input payment information, you must input something—if you skip around and just put the payment amount in (without the interest rate or length of the loan), you won't get credit for any equity buildup—the computer just can't tell what equity buildup will actually be better than what's shown.
Following is a list of the major variables used in INVEST. There are others used mathematically, so if you change the program, please read through it to make sure you don't use something already used.
| Table 1. | |
| INVEST | |
| Major variables: | |
| E$ | . . . date |
| A$ | . . . Property address |
| M1$ | . . misc. information (1) |
| M2$ | . . misc. information (2) |
| PR | . . . asking/purchase price of the property |
| L | . . . . estimated life for depreciation |
| A | . . . . % estimated annual asset appreciation |
| R | . . . . current rents |
| AR | . . . anticipated rents |
| M | . . . . months of ownership this year |
| T | . . . . estimated taxes and insurance per month |
| E | . . . . estimated expenses per month |
| V | . . . . % land value (as a percent of the price) |
| B | . . . . the tax bracket you're in |
| DP | . . . down payment amount |
| F | . . . . % furnishing's value (% of the price) |
| F1 | . . . first year cash flow |
| F2 | . . . second year cash flow (full year) |
| EB | . . . equity buildup, first year |
| ET | . . . equity buildup, second year |
| A5 | . . . asset appreciation, first year |
| A6 | . . . asset appreciation, second year |
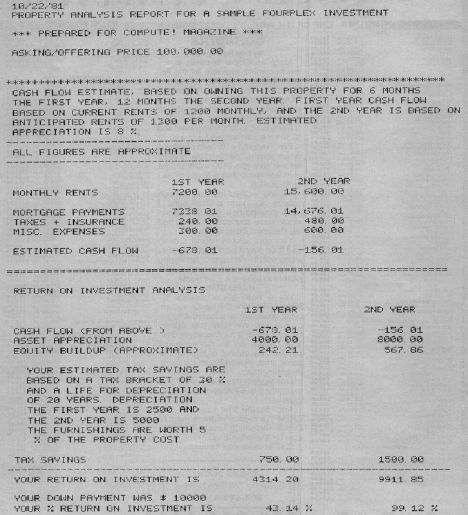
Figure 1: Sample Run